
On this page
- Quick Reference (60 Seconds)
- What the Standard Actually Requires
- Why This Control Matters
- Scope and Applicability
- Key Definitions and Terminology
- Relationship to Other Clauses
- Detailed Implementation Guidance
- Tools, Technologies, and Solutions
- Policy and Procedure Templates
- Risk Assessment and Treatment
- Audit and Compliance Checklist
- Metrics and KPIs
- Common Pitfalls / Audit Failures
- Illustrative Scenario 1: Failure
- Illustrative Scenario 2: Success
- Multi-Framework Mapping
- Implementation Roadmap
- FAQ
- Industry-Specific Requirements
- Maturity Model
- Emerging Trends
- References and Further Reading
Quick Reference (60 Seconds)
| Attribute | Detail |
|---|---|
| Clause | ISO 22301:2019 Clause 9.1, Monitoring, Measurement, Analysis and Evaluation |
| Objective (paraphrase) | ISO 22301 Clause 9.1 asks organizations to decide what to monitor and measure about BCMS performance, how, and when, and evaluate the results. |
| Domain | Clause 9 (Performance evaluation); the operational instrumentation layer of the BCMS, distinct from 9.2 (independent internal audit) and 9.3 (strategic top-management review). |
| What you must do | Decide what BCMS performance parameters to monitor and measure (process, outcome, capability, governance metrics); choose methods and the level of detail; set measurement cadences; assign owners; analyse results against objectives, thresholds, and trends; evaluate what the results mean; retain documented information of results; feed the analysis into 9.3 (management review) and 10.1/10.2 (corrective action and continual improvement). |
| Typical owner | Business Continuity Manager (BCM) / Head of Resilience, accountable to the CISO or COO. In regulated firms (RBI/SEBI/IRDAI), the BCM reports BCMS performance to the Board Risk/IT Committee; in many Indian enterprises the CISO owns the cyber-resilience subset and the BCM owns the wider continuity KPI set. |
| Maturity range | L1 (ad hoc counting, number of drills, number of plans, no analysis) → L5 (real-time BCMS performance dashboard with predictive trend lines, automated threshold breach alerts, and closed-loop corrective-action integration). |
| Audit red flag | A "metrics pack" that has shown the same green RAG status for eight consecutive quarters; KPI definitions that no one can explain; an objective (Clause 6.2) with no matching measurement; a real disruption whose RTO was missed but whose "RTO achievement %" KPI remained green; a monitoring plan written two years ago that no one has revisited. |
| Quick win | Pull your last four management-review packs. Check (a) whether each Clause 6.2 BC objective has a current measured value, (b) whether the KPIs in the pack have defined formulas and owners, and (c) whether any KPI crossed a threshold that triggered a corrective-action ticket. If the answer to any of those is no, you have your first 9.1 finding. |
| Time to implement | 3–6 months to a defensible monitoring & measurement plan with an operating quarterly dashboard (L2); 12–18 months to threshold-driven evaluation with corrective-action integration and trend analysis (L3–L4). |
| Related clauses | 6.2 (BC objectives, what 9.1 measures against), 8.1 (operational planning, processes 9.1 monitors), 8.2 (BIA, the RTO/RPO/MBCO baseline that 9.1 measures), 8.5 (exercises, primary source of capability measurements), 8.6 (evaluation of docs/capabilities, narrower and operational; 9.1 is the system-wide instrumentation), 9.2 (internal audit, independent assurance over what 9.1 produces), 9.3 (management review, the consumer of 9.1's outputs), 10.1 (corrective action, destination for 9.1 findings), 10.2 (continual improvement, the upward shift 9.1 evidence makes possible). |
| Key Indian hooks | RBI Master Direction on IT Governance, Risk, Controls and Assurance Practices (7 Nov 2023, eff 1 Apr 2024), board review of BCP/DR performance, IT-service-continuity metrics, SLA monitoring; RBI Cyber Security Framework in Banks (2 Jun 2016), SOC, ALM-style resilience baseline, incident reporting within 2–6 hours (measurement trigger); SEBI Cybersecurity and Cyber Resilience Framework, CSCRF (CIR/2024/113, 20 Aug 2024), the six functions including "Detect" and "Learn"; SEBI BCP/DR for MIIs (CIR/2021/33, 22 Mar 2021), RTO/RPO measurement, live/parallel DR drill reporting; IRDAI Information and Cyber Security Guidelines 2023 (24 Apr 2023), annual compliance reporting and DR drill performance; CERT-In Directions (20(3)/2022-CERT-In, 28 Apr 2022), 6-hour report (the time-to-detect and time-to-notify metrics), 180-day log retention (the evidentiary substrate); DPDP Act 2023 §8(5)/(6), availability and breach notification (the continuity-of-personal-data metric); Companies Act 2013 §134(3)(n)/§177, board risk oversight that treats unmeasured risk as undisclosed risk. |
The single sentence to remember: what gets measured gets managed, and Clause 9.1 is the clause that forces a BCMS to be measured, not assumed. A BCM programme that does not measure its RTO achievement, its exercise pass rate, its recovery-time drift, its supplier-BC test results, and its corrective-action closure rate is a programme built on assertion. Clause 9.1 is the discipline that turns assertion into evidence, and evidence is what an auditor, a regulator, a board, and (when the worst happens) a customer will ask to see.
What the Standard Actually Requires
Figure · Process
What Clause 9.1 asks you to do
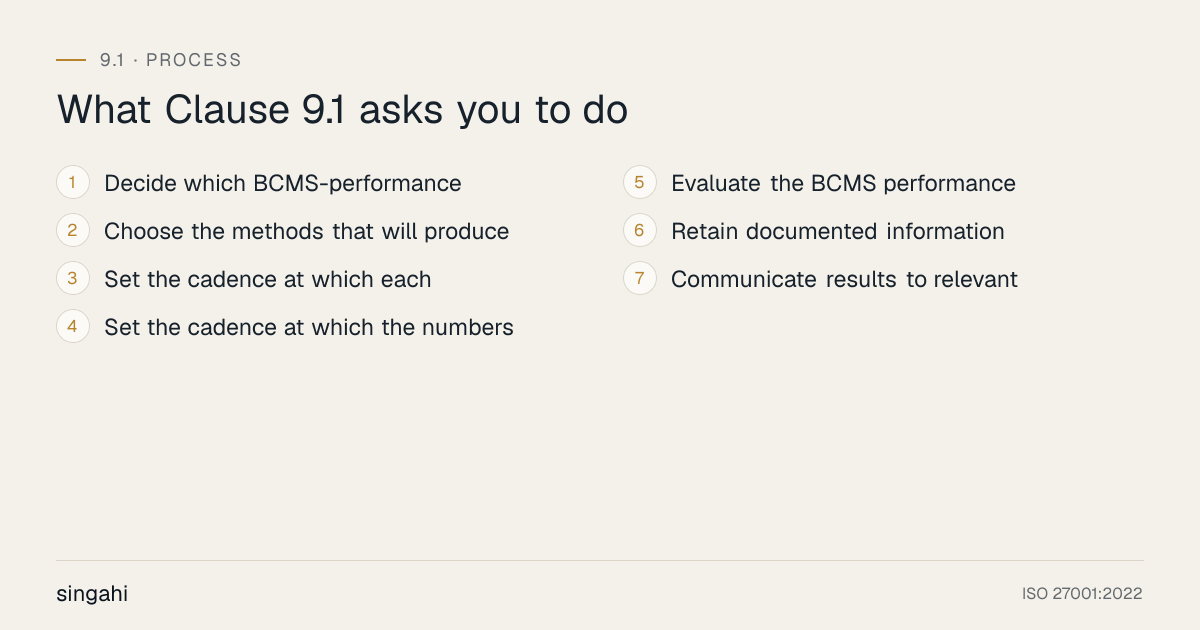
ISO 22301 Clause 9.1 asks organizations to decide what to monitor and measure about BCMS performance, how, and when, and evaluate the results. In operational terms, the clause requires the organisation to instrument its BCMS the way a responsible engineering team instruments a production system: pick the indicators that actually reveal whether the system is working, choose methods that produce trustworthy numbers, set a cadence that catches drift before it becomes failure, analyse the numbers against what was promised, and turn the analysis into decisions.
What the clause requires in substance
Read alongside ISO 22313:2020 (the companion guidance), ISO 22300:2021 (vocabulary) and the wider management-system genealogy (ISO 27001 Clause 9.1, ISO 9001 Clause 9.1), the requirement breaks into seven interlocking obligations:
-
Decide which BCMS-performance parameters warrant observation and quantification. The organisation must consciously choose the parameters that justify the cost of measurement. The choice is a judgement, not a default. A good parameter meets four tests: it maps to a BC objective (Clause 6.2) or a regulatory duty; it is materially affected by BCMS work (so movement in the number reflects BCMS performance, not noise); it is quantifiable at acceptable cost (data available, formula tractable); and it is actionable (a movement triggers a decision, not just a conversation). The four families are: (a) process metrics, exercise schedule adherence, BIA review cycle adherence, plan-review currency, training completion, awareness penetration; (b) outcome metrics, RTO/RPO achievement in exercises and real disruptions, time-to-activate, time-to-notify, MBCO delivery, customer-facing availability during continuity events; (c) capability metrics, replication health, backup restore-success rate, DR site readiness, contact-list currency, supplier-BC test pass rate, single-points-of-failure count; and (d) governance metrics, corrective-action closure rate, repeat-finding rate, audit nonconformity trend, management-review action closure, regulatory-reporting timeliness.
-
Choose the methods that will produce trustworthy numbers. The clause explicitly requires the methods to be sufficient to yield valid results, a number you can trust. This means each metric must have a written definition (numerator, denominator, inclusions, exclusions), a defined data source, a defined owner, a defined calculation cadence, and a defined validation step. Methods span automated system telemetry (uptime, replication lag, restore latency), structured human observation (exercise evaluation, drill scoring), evidence sampling (plan currency checks, contact-tree sampling), and regulatory clock measurement (time-to-CERT-In-report, time-to-RBI/SEBI/IRDAI report). The "valid results" qualifier is what rules out the most common anti-pattern: a metric defined loosely enough that two people would compute it differently. When the BCM computes "RTO achievement %" using exercise data and the IT/DR lead computes it using real incident data, the result is not valid, and Clause 9.1's methods requirement is violated.
-
Set the cadence at which each parameter is observed. Cadence is a substantive requirement, not a procedural one. The organisation must set, per metric, the frequency at which the measurement is taken: real-time (system availability, replication health), daily (backup success, SOC alert volume), weekly (open corrective actions, plan-change requests), monthly (exercise programme progress, training completion), quarterly (RTO achievement trend, supplier-BC test pass rate, RAG status), semi-annually (full BIA-currency check for tier-1 activities), annually (full BCMS performance review for management review under 9.3, regulator-facing compliance certificate). Cadence must match the half-life of the underlying parameter: contact-list currency decays weekly in a growing company, so a quarterly measurement will under-report decay; RTO strategy drift is slow, so an annual re-BIA is sufficient.
-
Set the cadence at which the numbers will be examined and judged. A measurement without analysis is noise; analysis without evaluation is a spreadsheet. The clause requires the organisation to define, per metric or metric family, when the numbers will be looked at and judged. Typical cadences: monthly operational review by the BCM with activity owners; quarterly BCMS performance review by the BCM steering group; semi-annual review with the CISO/COO; annual review at the management-review meeting (Clause 9.3). Evaluation must compare the measured value against (a) the Clause 6.2 objective target, (b) a defined threshold or tolerance band, (c) the prior period (trend), and (d) where applicable a benchmark (sector RTO/RPO guidance, regulator-published industry data).
-
Evaluate the BCMS performance. The clause's verb is evaluate, not report. Evaluation is a judgement: given the measured evidence, is the BCMS performing at the level the organisation has promised (objectives), the level the regulator requires (RBI/SEBI/IRDAI/CERT-In), and the level the business actually needs (continuity of prioritised activities during realistic disruptions)? Evaluation must produce a defensible answer to that question, green/amber/red against each objective, with a written rationale for any red and a stated corrective intent. The evaluation is what feeds Clause 9.3 (management review) and Clause 10.1/10.2 (corrective action and continual improvement).
-
Retain documented information of results. Measurements, analyses, and evaluations must be retained as documented information (Clause 7.5), the dashboard pack, the trend chart, the threshold-breach log, the evaluation memo, the management-review input. Retention serves three purposes: it is the evidence a certification auditor and a regulator will request; it is the substrate for year-on-year trend analysis; and it is the institutional memory that survives a BCM's departure. The retention period should align with the longest applicable regulator requirement (e.g., CERT-In 180 days for logs, IRDAI's annual-cycle records, RBI's typical five-year supervisory look-back).
-
Communicate results to relevant interested parties. Implicit but load-bearing: measurement that does not reach a decision-maker has no effect. The clause expects results to flow to activity owners (operational learning), the BCM steering group (programme decisions), top management (Clause 9.3 strategic decisions), the board Risk/IT Committee (governance), and, where relevant, regulators (compliance returns) and critical suppliers (performance feedback). Communication must be timely enough to act on (a breached RTO threshold reported the next quarter is too late).
What the clause does NOT require
This demarcation matters because over-building a measurement programme burns money and creates "metrics theatre":
- It does not require every BCMS activity to be measured. Measurement has cost; the organisation chooses the parameters that meet the four tests above. A 250-person firm with five prioritised activities may operate a defensible 9.1 programme on 20–30 metrics; a 5,000-person bank may run 80–120. The clause asks for a considered set, not a large set.
- It does not require a specific measurement technology. Excel on SharePoint, a BI dashboard, an enterprise IRM suite, or a BCM-specialist SaaS, all are acceptable. What matters is that the data is trustworthy, the formulas are documented, and the evaluation is honest.
- It does not require real-time measurement of everything. Real-time telemetry belongs where the parameter decays fast (system availability, replication) or where a regulatory clock runs (time-to-notify). Many BCMS parameters are properly measured quarterly or annually. A "real-time BCMS dashboard" for a metric that genuinely changes once a year is a vanity expense.
- It does not require independent verification of every measurement. Independence is the role of Clause 9.2 (internal audit). Clause 9.1 is management's measurement of its own system; the BCM and activity owners can measure their own performance, with internal audit providing independent assurance over the measurement process (not the numbers themselves) at planned intervals.
- It does not require benchmarking. External benchmarking is useful (sector RTO/RPO data, BCI Horizon Scan, regulator-published incident data) but not mandatory. The primary evaluation reference is the organisation's own Clause 6.2 objectives and the regulator's stated minimum.
- It does not require every measurement to be turned into a corrective action. A green metric is a valid outcome; the clause requires evaluation, and a defensible evaluation may legitimately conclude "this parameter is at target, no action." The auditor's suspicion falls on programmes that never find a red, that is a measurement failure, not a performance success.
The 9.1 vs 9.2 vs 9.3 demarcation (the most-tested distinction)
Among the three performance-evaluation clauses, 9.1 is the broadest and the most operational, and its boundary with 9.2 and 9.3 is the most frequently examined in certification audits. A simple way to hold the distinction:
- 9.1 (this clause) is management measuring its own system, continuously. Owners: BCM, activity owners, IT/DR. Cadence: real-time through annual. Output: dashboards, trend packs, threshold-breach tickets, evaluation memos. Independence: none required (it is first-line measurement). Question answered: "Is the BCMS performing, and where is it drifting?"
- 9.2 (internal audit) is an independent function auditing the BCMS at planned intervals. Owner: internal audit (or an external auditor), independent of the BCM. Cadence: at planned intervals (typically annual, plus follow-ups). Output: audit findings (conformity/nonconformity), audit report to top management. Independence: required. Question answered: "Does the BCMS conform to ISO 22301 and to our own documented requirements, and is it effectively implemented?"
- 9.3 (management review) is top management reviewing the BCMS strategically at planned intervals. Owner: top management (CEO/COO/CISO), chaired by the BCMS sponsor. Cadence: at planned intervals (typically annual, with semi-annual in larger firms). Output: decisions on continuing suitability, adequacy, effectiveness; resourcing; strategic changes. Independence: top-management perspective. Question answered: "Is the BCMS still the right system for this organisation, at this scale, in this risk environment, and what should change?"
The flow is: 9.1 produces the evidence → 9.2 independently tests the system and the evidence → 9.3 consumes 9.1 and 9.2 outputs to make strategic decisions → 10.1/10.2 act on what 9.1/9.2/9.3 find. A common failure is to collapse these into one "annual review", which produces neither trustworthy measurement (9.1), nor independent assurance (9.2), nor strategic challenge (9.3). They are distinct disciplines with distinct owners, cadences, and outputs.
What auditors actually check
A certification auditor (and a regulator such as RBI, SEBI, IRDAI, or CERT-In) will look for the following concrete evidence that Clause 9.1 is alive in the organisation:
- A monitoring & measurement plan (MMP), a documented artefact listing each metric, its definition (numerator/denominator/exclusions), its data source, its owner, its calculation cadence, its analysis cadence, its threshold or target, and the action triggered by a breach. The MMP is the 9.1 equivalent of the BIA in 8.2: the master artefact.
- KPI definitions sheet, a controlled document (under Clause 7.5) that defines each metric unambiguously. The auditor will pick two or three metrics and ask two different people to compute them; inconsistent answers are a finding.
- Operating dashboards or packs, the actual quarterly/annual measurement outputs, with dates, owners, and values. The auditor will look for continuity: a metric that appeared for two quarters and then vanished is a red flag.
- Threshold-breach records, when a metric crossed into amber/red, what happened? Was a corrective-action ticket opened under Clause 10.1? Was it escalated? Was it resolved? A breach with no action is the signature 9.1 finding.
- Trend analysis, the year-on-year or quarter-on-quarter view that shows whether performance is improving, flat, or degrading. Single-point measurements ("this quarter we are at 92%") are weaker than trends ("three quarters of decline from 96% to 92%").
- The link to Clause 6.2, every BC objective should have at least one matching metric. An objective with no measurement is a Clause 6.2 finding, but it surfaces in 9.1.
- The link to Clause 9.3, management-review minutes that explicitly reference 9.1 outputs as an input (per the 9.3 input list). The 9.1 pack is the single largest input to a well-run management review.
- The link to Clause 10.1, corrective-action tickets traceable from 9.1 findings, with closure evidence. The loop from measurement → finding → action → re-measurement is what the auditor traces.
- Regulatory-reporting timeliness, for RBI/SEBI/IRDAI/CERT-In-regulated firms, the time-to-notify metrics with the actual notification record. A measured "6.2-hour average time-to-CERT-In-report" with the supporting incident log is strong evidence; an assertion "we always report within 6 hours" with no measurement is weak.
The most common Clause 9.1 finding in the Indian context is not that the organisation measured nothing, it is that the organisation measured the wrong things, or measured the right things but never evaluated the results (so the measurement existed but the loop was broken). The "DBS recurrence" pattern, where the same outage root cause repeats across quarters, is fundamentally a 9.1 failure: the measurement that would have caught the drift either did not exist or did not trigger action.
Why This Control Matters
The business risk of an unmeasured BCMS
A business continuity management system that is not measured is not a management system, it is a documentation library. The discipline that converts the library into a system is measurement: the structured, repeated act of asking, with evidence, whether the BCMS is doing what it claims to do. Without that discipline, three pathologies take hold in any growing company.
First, silent drift. BCMS arrangements decay invisibly. An RTO that was achievable in 2023 with a four-person recovery team is unachievable in 2026 when three of those people have left. A replication link that ran at 30 minutes of lag in 2023 creeps to 90 minutes by 2026 as data volume grows. A supplier-BC test that passed in 2023 fails in 2026 because the supplier re-platformed. None of this drift is visible to the people who would catch it until a real disruption exposes it. Clause 9.1 is the early-warning system: the metric that turns silent drift into a flagged trend, months before the disruption.
Second, improvement theatre. A BCMS without measurement can show activity (exercises conducted, plans written, trainings delivered) but cannot show effect (whether the exercises improved recovery capability, whether the plans would work, whether the training changed behaviour). Boards, regulators, and customers increasingly ask the effect question, and an organisation that can answer only the activity question is, in regulatory terms, an organisation that cannot evidence its own resilience. The IRDAI annual compliance certificate, the SEBI CSCRF self-assessment, the RBI supervisor's question on digital-outage recurrence, all are effect questions.
Third, recurrence. When the same incident root cause appears across quarters, the organisation is paying for the same lesson repeatedly. The pathology is almost always a 9.1 pathology: the post-incident review identified the root cause (Clause 8.6), but no metric was set on the corrected control, so no measurement caught the regression, so no corrective action fired. The most expensive sentence in continuity management is "we have seen this failure before." Measurement is what makes that sentence stoppable.
The Indian regulatory context
Indian regulators have, over the past five years, made BCMS performance measurement explicit and prescriptive. The pattern across sectors is converging on the same model: define quantitative thresholds, measure against them, report the result, and face supervisory consequence if the result is poor or the measurement was not done.
- RBI Master Direction on IT Governance, Risk, Controls and Assurance Practices (7 November 2023, effective 1 April 2024) consolidates and strengthens the expectation that banks and NBFCs define, measure, and report IT-service-continuity metrics. The Master Direction treats repeated digital outages as a governance failure precisely because the measurement that would have caught the drift either did not exist or did not reach the board. The board's role is not to read the dashboard; it is to confirm that the dashboard exists, is trustworthy, and drives action. That is the 9.1 discipline codified as a regulatory expectation.
- RBI Cyber Security Framework in Banks (2 June 2016) introduced the ALM-style "baseline cyber security and resilience requirements," the 24x7 SOC expectation, and the 2–6 hour incident-reporting clock. Each of these is a measurement obligation in disguise: the SOC exists to detect and measure; the baseline exists to measure against; the reporting clock exists to measure time-to-notify. A bank that operates a SOC but does not measure its mean-time-to-detect, mean-time-to-respond, and reporting-clock adherence is operating half a framework.
- SEBI Cybersecurity and Cyber Resilience Framework (CSCRF) (CIR/2024/113, 20 August 2024) structures the resilience regime around six operational functions, Identify, Protect, Detect, Respond, Recover, Learn. The Detect function is, in substance, a Clause 9.1 measurement obligation: detect anomalies, measure cyber-resilience posture, report indicators. The Learn function is measurement of a different kind: post-incident measurement of what worked, fed back into controls. CSCRF is, in many ways, the most measurement-forward Indian resilience regulation, it expects quantitative metrics, threshold alerting, and reporting.
- SEBI BCP/DR for Market Infrastructure Institutions (CIR/2021/33, 22 March 2021) is the marquee measurement circular for exchanges, clearing corporations, and depositories. It defines RTO (≤2 hours for critical systems) and RPO expectations, requires live/parallel DR drills (which are measurements of recovery capability), and expects MIIs to report drill performance to SEBI. The MII that runs the drill but does not measure RTO achievement against the ≤2-hour target is non-compliant.
- IRDAI Information and Cyber Security Guidelines 2023 (24 April 2023) require insurers to measure DR drill performance, report annually within 90 days of financial year-end, and have the Board's Risk/IT Committee oversee BCP/DR. The annual compliance certificate is, in substance, a management assertion that the 9.1 measurement cycle has been completed and the results evaluated.
- CERT-In Directions (20(3)/2022-CERT-In, 28 April 2022) impose the 6-hour incident-reporting clock, the 180-day log-retention requirement, the NTP clock-sync mandate, and the cooperation-with-investigation duty. The 6-hour clock is a measurement target, mean-time-to-notify must be measurably under 6 hours, exercised and tested. The 180-day log retention is the evidentiary substrate without which measurement of past incidents is impossible. An organisation that cannot produce a measured time-to-notify for each reportable incident is non-compliant with CERT-In, not just with ISO 22301.
- DPDP Act 2023 (Act 22 of 2023) §8(5) makes availability of personal data a statutory duty of the Data Fiduciary; §8(6) and the Schedule make breach notification a timed duty; the DPDP Rules 2025 (final notified November 2025) prescribe the 72-hour breach-notification form. Each is a measurement obligation: availability must be measured (uptime, recovery); breach notification must be measured (time-to-Board, time-to-affected-principals). Significant Data Fiduciaries face enhanced audit and DPIA cadences, themselves a measurement discipline.
- Companies Act 2013 §134(3)(n) requires the Board's Report to disclose risks that "may threaten the existence of the company itself", a duty that, read alongside §177 (Audit Committee) and SEBI LODR Regulation 21 (Risk Management Committee), effectively requires listed companies to measure their principal operational and continuity risks. A risk that is named in the Board's Report but not measured in the risk register is a disclosure failure as much as a measurement failure.
The cost of non-compliance, in numbers
The financial consequence of a 9.1 failure is rarely a 9.1 fine (Clause 9.1 itself is not penalised directly); it is the cost of the disruption that measurement would have prevented or contained. The Indian anchors are illustrative:
- The HDFC Bank RBI action of 2 December 2020 (an order issued under the Banking Regulation Act, 1949, prohibiting new digital products and fresh credit cards for an extended period) followed repeated digital outages. The recurrence pattern is the diagnostic 9.1 failure: the measurement that would have caught the degradation either did not exist or did not trigger the corrective-action loop. The cost was strategic, a product freeze, rather than a rupee fine, but the strategic cost was far larger than any fine would have been.
- The Cognizant Maze ransomware incident of April 2020 (disclosed in SEC filings; the company estimated $50–70 million in recovery costs) is an example of measurement-driven cost containment gone wrong: the company's own SEC disclosures detail the financial impact of the disruption. A 9.1 discipline that measured the underlying supply-chain and credential-hygiene parameters in the months before the incident would, in principle, have caught the drift.
- The LG Polymers Vizag incident of 7 May 2020 (the National Green Tribunal imposed a ₹50 crore interim penalty; subsequent legal proceedings continued) is a different 9.1 lesson: industrial-continuity measurement (per NDMA Chemical Disaster Guidelines 2007) of safety-critical parameters is the kind of measurement whose absence converts a near-miss into a catastrophe.
- The DPDP Act's penalty ceiling of ₹250 crore for failure to take adequate security safeguards, and ₹200 crore for failure to notify a breach, are the new upper bound on the cost of unmeasured risk. The Data Protection Board will, when adjudicating, ask what the Data Fiduciary measured; the organisation that measured nothing has no "adequate safeguards" defence.
These are illustrative figures drawn from primary disclosures; the underlying lesson is consistent: the cost of measurement is a fraction of the cost of the disruption measurement would have prevented.
Scope and Applicability
Who must comply
Clause 9.1 applies to every organisation that claims conformity to ISO 22301:2019, there is no size or sector exemption. The clause's scope is the BCMS itself: every process, every prioritised activity (per Clause 8.2), every continuity strategy (Clause 8.3), every plan (Clause 8.4), every exercise (Clause 8.5), every supplier relationship that supports a prioritised activity, and every regulatory duty that intersects with continuity.
For Indian organisations, the practical scope is shaped by sector:
- BFSI (banks, NBFCs, payment system operators, urban cooperative banks), the broadest continuity-measurement obligation. RBI-regulated entities must measure IT-service-continuity metrics (availability, RTO/RPO, incident recurrence, supplier performance) and report them up to the Board Risk/IT Committee. The RBI Master Direction's reach (NBFCs with asset base ≥ ₹500 crore, all scheduled commercial banks except payments banks/LABs/RRBs, all-India financial institutions, credit information companies) defines the population for whom 9.1 is non-negotiable.
- Capital markets (MIIs, brokers, AMCs, AIFs, RTAs, KYC RAs, portfolio managers), SEBI CSCRF (2024) graded REs into five categories, each with a defined measurement and reporting set. For MIIs specifically, the SEBI BCP/DR circular (2021) defines the measurement content (RTO/RPO, live-failover drills, document currency).
- Insurance, IRDAI Guidelines 2023 apply to all insurers (life, general, health, reinsurers, FRBs) and intermediaries; the annual compliance reporting cycle is, in effect, the regulator-facing 9.1 output.
- All Indian ICT operators, CERT-In Directions apply horizontally; the 6-hour report and 180-day logs are measurement obligations.
- All Data Fiduciaries, DPDP Act 2023 applies to every entity that determines the purpose and means of processing digital personal data; Significant Data Fiduciaries face enhanced measurement (DPIA cadence, Data Audit).
- Manufacturing, energy, chemicals, pharma, NDMA guidelines (Chemical Disasters 2007; the DMP template 2014) impose measurement of safety-critical continuity parameters; the Factories Act 1948 and sector regulators (PESO, CPCB) layer industry-specific measurement.
- Healthcare, the Clinical Establishments Act (where applicable), NABH standards, and the DPDP Act (health data is sensitive) collectively impose continuity-measurement obligations on hospitals, diagnostics, and health-tech.
- Government and PSUs, NDMA guidelines, the National Policy on Disaster Management 2009, and CAG audit expectations impose measurement of departmental disaster-management-plan currency and effectiveness.
Applicability by organisation size
The clause is the same for a 50-person SaaS firm and a 50,000-person bank, but the implementation scales.
- Small (10–250 employees). A defensible 9.1 programme can run on 15–25 metrics, calculated monthly and evaluated quarterly, using office-suite tools (Excel on SharePoint/Google Workspace) with manual data collection. The BCM (often a part-time role) owns the measurement. The annual cost is mostly labour: 0.2–0.5 FTE on measurement activities. Typical INR range: ₹3–8 lakh per year (mostly staff time; modest tooling).
- Mid-market (250–2,000 employees). A 30–50 metric set, calculated daily-to-quarterly depending on the parameter, on a BI dashboard or a mid-segment GRC SaaS. The BCM owns the programme; activity owners contribute data. Annual cost: ₹15–40 lakh (tooling ₹8–20 lakh, FTE ₹7–20 lakh).
- Large (2,000+ employees) and regulated. A 60–120 metric set, with real-time telemetry for system parameters, integrated dashboards (often an enterprise IRM suite), supplier-performance scorecards, and regulator-facing reporting workflows. Annual cost: ₹80 lakh to several crore, depending on integration depth.
These ranges are illustrative third-party cost ranges for the measurement programme (tooling plus labour); they are not Singahi pricing.
What is in scope for measurement
A practical scope checklist for a typical Indian organisation:
- All Clause 6.2 BC objectives (each must have at least one measurement).
- All prioritised activities identified in the BIA (Clause 8.2), their RTO/RPO/MBCO values and the actual achievement against those values.
- All BC strategies (Clause 8.3), their effectiveness measures (supplier-BC test pass rate, DR site readiness, work-area recovery currency).
- All BC plans and procedures (Clause 8.4), their currency (last reviewed), exercise performance, and contact-tree accuracy.
- The exercise programme (Clause 8.5), schedule adherence, exercise pass rate, action closure.
- All continuity-relevant regulatory duties (RBI/SEBI/IRDAI/CERT-In/DPDP), their measurement (time-to-notify, drill cadence, log-retention currency).
- All critical suppliers, their BC performance (per the Clause 8.1 outsourced-activities control).
- The corrective-action and continual-improvement system (Clauses 10.1, 10.2), closure rate, repeat-finding rate, improvement-opportunity throughput.
What is out of scope for measurement
- Strategic business metrics that are not BCMS-related (revenue growth, market share, customer NPS), these belong to the business scorecard, not the BCMS scorecard. The BCMS measurement programme is a subset of business measurement, focused on continuity and resilience.
- Pure information-security metrics that have no continuity dimension (e.g., phishing-click rate) unless the organisation has chosen to fold them into a resilience scorecard. ISO 27001 Clause 9.1 covers the ISMS measurement; ISO 22301 Clause 9.1 covers the BCMS. The overlap (cyber-driven disruption) is the organisation's choice to manage.
- Personal-performance metrics for individual employees, which belong to HR management, except where an individual's role is a continuity single-point-of-failure (in which case the role, not the person, is measured via deputy-currency).
Key Definitions and Terminology
A precise vocabulary matters because the most common 9.1 failures are vocabulary failures: two people computing the same metric differently and producing different numbers. The definitions below reconcile ISO 22300:2021 with the BCI practitioner guidance and the DRI professional-practice framework, presented neutrally.
- Monitoring. The continuous or frequent act of observing a parameter to detect change. Monitoring is detection-oriented: is the parameter where it should be? System availability monitoring, replication-lag monitoring, SOC alert monitoring. Monitoring answers "what is happening right now?"
- Measurement. The structured act of assigning a value to a parameter against a defined scale, using a defined method. Measurement is quantification-oriented: what is the value? RTO achievement %, time-to-notify in minutes, exercise pass rate. Measurement answers "what is the value?"
- Analysis. The act of examining a set of measurements to identify patterns, trends, correlations, anomalies. Analysis is pattern-oriented: what is the data telling us? Trend lines, year-on-year comparisons, cohort analysis, threshold-breach detection. Analysis answers "what does the data mean?"
- Evaluation. The act of forming a judgement about the BCMS based on the analysis. Evaluation is judgement-oriented: is the BCMS performing acceptably? RAG status, the management-review input, the regulator-facing compliance assertion. Evaluation answers "what do we conclude, and what do we do?"
- KPI (Key Performance Indicator). A metric that measures whether a BCMS activity is being performed well, exercise schedule adherence, plan-currency %, training completion %.
- KRI (Key Risk Indicator). A metric that measures whether a BCMS risk is increasing or decreasing, open high-risk audit findings, supplier-concentration index, single-points-of-failure count, near-miss frequency.
- KCI (Key Capability Indicator). A metric that measures whether a BCMS capability is intact, replication health, backup restore-success rate, DR site readiness, contact-list currency. (This term is less universal than KPI/KRI but useful in the BCM context.)
- Lagging indicator. A metric that measures outcomes that have already happened, actual RTO achieved in a real disruption, actual time-to-notify in a real incident. Lagging indicators confirm performance but cannot prevent it.
- Leading indicator. A metric that measures conditions that predict future performance, replication-lag trend, supplier-financial-health score, plan-currency %, deputy-coverage %. Leading indicators, when read correctly, allow preventive action.
- RAG status (Red / Amber / Green). A visual evaluation shorthand. Definitions must be set per metric: e.g., for RTO achievement, green = ≥95%, amber = 85–95%, red = <85%. RAG without definitions is theatre.
- Threshold / tolerance. The value at which a metric triggers a defined action. Thresholds must be set in advance, written down, and tied to corrective-action triggers, not applied retrospectively.
- RTO (Recovery Time Objective). Per ISO 22300:2021, the brief target time within which a prioritised activity must be resumed after a disruption. Measured in exercises and real disruptions as actual time-to-recover.
- RPO (Recovery Point Objective). The maximum data loss tolerable, measured backwards from the disruption event. Measured as actual data loss in exercises and real disruptions.
- MTPD (Maximum Tolerable Period of Disruption) / MAO (Maximum Acceptable Outage). Same concept, terminology variance. MTPD is current ISO's preferred label (per ISO 22301:2019 and ISO/TS 22318:2021); MAO is BCI practitioner guidance / ISO 22301:2012 legacy. Measured as the upper bound against which RTO is set (RTO must be ≤ MTPD).
- MBCO (Minimum Business Continuity Objective). The minimum level of service or activity that must be maintained during a disruption. Measured as the achieved service level during continuity events, e.g., transactions per minute during a partial recovery, beds staffed during a hospital evacuation.
- Mean Time To Detect (MTTD). The average time between an incident's start and its detection. A core SOC/cyber-resilience metric.
- Mean Time To Respond (MTTR). The average time between detection and the start of containment/recovery. A core response-capability metric.
- Mean Time To Recover (MTTR). The average time between the start of recovery and full service restoration. (Note the MTTR collision, the same acronym is used for Respond and Recover; disambiguate in the metric definition.)
- Time-to-notify (TTN). The elapsed time between incident detection and notification to the relevant regulator or party (CERT-In, RBI, SEBI, IRDAI, the DPDP Data Protection Board, affected individuals). Measured against the regulatory clock, 6 hours for CERT-In, 72 hours for DPDP breach-to-Board, "without delay" for affected individuals.
- Exercise pass rate. The percentage of exercised objectives met during a defined exercise. Distinguished from "drill completed" (which measures activity, not outcome).
- Corrective-action closure rate. The percentage of corrective actions opened in a period that were closed within the target closure window. The single most diagnostic 9.1 metric: if it is low, the measurement-to-action loop is broken.
- Repeat-finding rate. The percentage of findings in a period that are recurrences of previously identified findings. The metric that, more than any other, distinguishes a learning organisation from a recurring-failure one.
- Single-point-of-failure (SPOF) count. The number of components (people, systems, suppliers, facilities) whose loss would interrupt a prioritised activity. A leading indicator of resilience, falling SPOF count is improvement; rising SPOF count is drift.
Relationship to Other Clauses
Clause 9.1 is the instrumentation of the BCMS. It does not exist in isolation; it is wired into almost every other clause. The relationships matter because an auditor will trace these connections.
Upstream: what 9.1 measures
- Clause 4 (Context). The external and internal issues identified under 4.1 are the upstream reference for the risk environment metrics, the threat-landscape indicators, the regulatory-change indicators, the stakeholder-expectation indicators. A new regulator (DPDP Board activating), a new threat (a ransomware strain emerging), a new stakeholder expectation (a customer audit questionnaire asking for continuity evidence), each shifts the BCMS's operating context, and 9.1 should measure whether the BCMS keeps up.
- Clause 5 (Leadership). Top-management commitment is measured indirectly through governance metrics: management-review action closure (Clause 9.3 input), sponsor attendance at steering meetings, resourcing decisions documented.
- Clause 6 (Planning), especially 6.2. Every BC objective set under Clause 6.2 must have at least one matching 9.1 measurement. This is the load-bearing upstream relationship: an objective without a measurement is a Clause 6.2 finding, surfaced via 9.1.
- Clause 7 (Support). Resources (7.1) measured as programme budget vs plan; Competence (7.2) measured as training completion and competency-assessment pass rate; Awareness (7.3) measured as awareness-survey penetration; Communication (7.4) measured as comms-cadence adherence and stakeholder-feedback scores; Documented information (7.5) measured as document-currency %.
- Clause 8 (Operation). The richest source of measurement. 8.1 (operational planning) → process metrics. 8.2 (BIA) → RTO/RPO/MBCO definitions that 9.1 measures against, plus BIA-currency cycle adherence. 8.3 (strategies) → strategy-effectiveness metrics (supplier-BC test pass rate, DR readiness). 8.4 (plans) → plan-currency %, exercise-pass rate. 8.5 (exercise programme) → schedule adherence, exercise-pass rate, action-closure. 8.6 (evaluation of docs and capabilities) → corrective actions generated, currency %.
Downstream: what consumes 9.1 outputs
- Clause 9.2 (Internal audit). Internal audit's job is to provide independent assurance that the BCMS conforms to requirements and is effectively implemented. 9.1 outputs are a primary audit input, the auditor reviews the MMP, the dashboards, the threshold-breach records, and tests the measurement process (not the numbers themselves). A weak 9.1 programme generates a 9.2 finding on the measurement system; a strong 9.1 programme gives the auditor confidence to focus elsewhere.
- Clause 9.3 (Management review). The 9.3 input list explicitly includes "information on BCMS performance and trends, including those relating to ... monitoring, measurement, analysis and evaluation." The 9.1 evaluation pack is the single largest input to a well-run management review. Without 9.1, 9.3 becomes an opinion exchange; with 9.1, 9.3 becomes an evidence-led strategic decision.
- Clause 10.1 (Corrective action). Threshold breaches in 9.1 metrics are the primary trigger for 10.1 corrective actions. The chain: metric breaches → threshold-breach record → root-cause analysis → corrective-action ticket → corrective action implemented → metric re-measured → closure.
- Clause 10.2 (Continual improvement). 9.1 trends are the evidence base for 10.2: an upward RTO-achievement trend over four quarters is the evidence that the BCMS is improving; a flat trend is the evidence that it is not.
The 9.1 / 9.2 / 9.3 distinction (recap, with examples)
To make the distinction concrete:
- 9.1 example: the BCM measures that average RTO achievement in Q3 exercises was 87% against a target of 95%; evaluates this as amber (below target but above red threshold of 80%); opens a corrective-action ticket to investigate; reports the trend to the BCM steering group.
- 9.2 example: internal audit, independently, audits the BCMS for the year. Among its findings: the RTO-achievement metric's definition was changed mid-year without version control, weakening the validity of the trend. The audit issues a nonconformity against Clause 9.1 (methods not sufficient to ensure valid results).
- 9.3 example: at the annual management review, top management sees the 87% RTO achievement, the audit finding on metric definition, and the trend of three quarters of decline. Top management decides: (a) to invest in an enterprise IRM suite to harden metric governance; (b) to set a new BC objective of 95% RTO achievement within 12 months; (c) to elevate BCMS performance reporting to the Board Risk Committee quarterly.
The three clauses form a chain: 9.1 measures → 9.2 audits the measurement → 9.3 decides on what the audit and measurement together reveal.
Detailed Implementation Guidance
This section is the operational core of the guide. It is structured as a seven-step implementation path, tiered by maturity.
Step 1, Charter the monitoring & measurement programme
Before any metric is defined, the programme needs a charter: a short document (one to two pages) approved by the BCMS sponsor (COO or CISO) that establishes:
- The purpose of the programme (to provide evidence of BCMS performance against Clause 6.2 objectives and regulatory duties, and to feed Clause 9.3 and Clause 10).
- The scope (what is in and out of measurement, see §4.3/§4.4).
- The owner (the BCM) and the governance (steering group, escalation path).
- The principles the programme will follow. Recommended principles:
- Few metrics, well-defined. Prefer 25 well-defined metrics over 100 loose ones.
- Effect over activity. Prefer "RTO achievement %" over "exercises conducted."
- Trend over point. Prefer a four-quarter trend over a single measurement.
- Threshold-tied. Every metric has a green/amber/red threshold tied to a corrective-action trigger.
- Documented formulas. Every metric has a written definition (numerator, denominator, exclusions).
- Honest evaluation. Red metrics are reported red; suppression is a discipline failure.
- The cadence (monthly operational, quarterly steering, semi-annual executive, annual management review).
- The budget (tooling, FTE, external services).
The charter is the artefact that survives leadership change. Without it, the programme is a person; with it, the programme is an institution.
Step 2, Build the monitoring & measurement plan (MMP)
The MMP is the master artefact of Clause 9.1, analogous to the BIA for Clause 8.2 or the exercise programme for Clause 8.5. It is a controlled document under Clause 7.5. Each row in the MMP describes one metric. Recommended columns:
- Metric ID (stable identifier, e.g., M-001).
- Metric name (short, unambiguous).
- Metric family (process / outcome / capability / governance).
- Definition (numerator, denominator, inclusions, exclusions, unambiguous).
- Why this metric matters (maps to which Clause 6.2 objective or regulatory duty).
- Owner (the person accountable for the metric, single name, not a team).
- Data source (the system or process from which the data is drawn).
- Collection method (automated / manual / sampled; sample size if applicable).
- Calculation cadence (real-time / daily / weekly / monthly / quarterly / annual).
- Analysis cadence (when the value is looked at; typically monthly or quarterly).
- Target (the Clause 6.2 objective value or the regulatory minimum).
- Threshold band (green / amber / red values).
- Action on amber (e.g., activity owner to investigate within 5 working days).
- Action on red (e.g., corrective-action ticket opened under Clause 10.1 within 2 working days; escalated to steering group).
- Reporting destination (which dashboard / pack / meeting).
- Last review date (when the metric itself was last reviewed for relevance and validity).
- Status (active / under review / retired).
A defensible 9.1 programme for a 250–2,000-person organisation typically has 30–50 rows in the MMP. The MMP is reviewed annually for relevance (some metrics will be retired; new ones added as objectives or risks change).
Step 3, Define the metric set
The four families (process, outcome, capability, governance) each deserve a defined minimum set. The §12 KPI catalogue gives the full list; the minimum defensible set for a growing company is:
Process metrics (minimum 6):
- Exercise schedule adherence % (Clause 8.5).
- BIA-currency cycle adherence % (Clause 8.2).
- Plan-review currency % (Clause 8.4 / 8.6).
- Training completion % (Clause 7.2/7.3).
- Awareness-survey penetration % (Clause 7.3).
- Documented-information review cycle adherence % (Clause 7.5).
Outcome metrics (minimum 5):
- RTO achievement %, exercises and real disruptions (Clause 8.3/8.4/8.5).
- RPO achievement %, exercises and real disruptions (Clause 8.3/8.4/8.5).
- Time-to-activate the BC response (Clause 8.4).
- Time-to-notify, CERT-In, RBI, SEBI, IRDAI, DPDP Board (Clause 8.4 + regulatory).
- Customer-facing service availability during continuity events (Clause 8.4 + customer SLA).
Capability metrics (minimum 5):
- Replication health (DR site readiness).
- Backup restore-success rate (tested in exercises).
- Contact-list currency % (Clause 8.4/8.6).
- Supplier-BC test pass rate (Clause 8.1 outsourced + 8.3).
- SPOF count for tier-1 prioritised activities (Clause 8.2/8.3).
Governance metrics (minimum 4):
- Corrective-action closure rate (Clause 10.1).
- Repeat-finding rate (Clause 10.1/10.2).
- Audit nonconformity count and trend (Clause 9.2).
- Management-review action closure % (Clause 9.3).
That is a defensible 20-metric starting set. The §12 catalogue expands this to 30+ for larger firms.
Step 4, Choose the methods and ensure validity
The clause explicitly requires methods "to ensure valid results." For each metric, the method has three components:
- Data source. Automated telemetry (system logs, replication-monitoring, backup-success logs) is preferred for capability metrics; structured observation (exercise evaluation forms, drill scoring rubrics) for outcome metrics; structured sampling (contact-list spot-checks, plan-currency audits) for process metrics; clock-based measurement (incident timestamps) for time-to-notify.
- Calculation. The formula must be written down, with worked examples. "RTO achievement %" must specify: numerator (number of exercised or real disruptions where actual time-to-recover ≤ RTO), denominator (number of exercised or real disruptions in the period), exclusions (e.g., disruptions where the exercise was deliberately aborted for safety). Two competent people should be able to compute the metric independently and get the same number.
- Validation. A periodic check that the metric still measures what it claims to measure. Validation triggers: a metric definition change, a data-source change, a finding that the metric is not moving when reality clearly is (or vice versa). The BCM should validate each metric at least annually.
Step 5, Set thresholds and tie them to action
A metric without a threshold is a number; a metric with a threshold is a control. For each metric:
- Green = at or above target. Action: none (continue monitoring).
- Amber = below target but above red. Action: activity owner investigates within a defined window (typically 5–10 working days); documents the cause; commits to a correction or accepts the deviation with rationale.
- Red = at or below red threshold. Action: corrective-action ticket opened under Clause 10.1 within a defined window (typically 2 working days); escalated to the BCM steering group; root-cause analysis conducted; correction implemented; metric re-measured to confirm recovery.
Thresholds must be set in writing, in advance. The anti-pattern is retrospective threshold setting ("this quarter was 60%, so let's call amber 55%"), that is measurement theatre, and an auditor will catch it.
Step 6, Build the dashboard and reporting cadence
The dashboard is where measurement meets decision. A well-designed dashboard has:
- A monthly operational view for activity owners, their metric, current value, trend, threshold status, open actions.
- A quarterly BCMS performance pack for the BCM steering group, all metrics, trend lines, threshold breaches, action closure, repeat findings, regulatory-reporting timeliness.
- A semi-annual executive view for the CISO/COO, RAG status per objective, top three risks, top three corrective actions, regulatory posture.
- An annual BCMS performance evaluation for management review (Clause 9.3), full-year trend, objective achievement, audit findings, regulatory performance, investment case for the next cycle.
- Regulator-facing reporting as required (IRDAI annual compliance certificate, SEBI CSCRF self-assessment, RBI supervisory submissions, CERT-In incident reports).
Dashboards should be visual (RAG status, trend lines, threshold bands marked) and concise (one page per audience). The anti-pattern is the 80-page quarterly pack that no one reads.
Step 7, Close the loop to action
Measurement that does not lead to action is theatre. The loop-closing mechanism is the threshold-breach ticket: a structured record, opened automatically or by the BCM when a metric crosses amber or red, that flows:
- Breach detected (monitoring or measurement).
- Ticket opened under Clause 10.1 with metric ID, value, threshold breached, date.
- Owner assigned (the activity owner or the BCM).
- Root-cause analysis conducted (using a defined method, 5 Whys, fishbone, fault-tree).
- Corrective action defined and committed with a target date.
- Corrective action implemented.
- Metric re-measured to confirm recovery.
- Ticket closed with evidence.
- Repeat-finding check, if the same metric breaches again within a defined window, the original root-cause analysis was incomplete; escalate.
The closure rate of these tickets is the single most diagnostic metric of the 9.1 programme itself. A closure rate of <85% means the loop is broken, measurement is happening, action is not.
Tiered implementation by maturity
The implementation path scales with maturity (see §22 for the full model):
- L1 (Ad hoc). No MMP. The BCM counts activities (drills, plans) for the annual report. No analysis, no evaluation, no thresholds. Findings are reactive (a real disruption prompts a look). Time to L2: 6–9 months.
- L2 (Defined). An MMP exists with 20–30 metrics. KPI definitions documented. Quarterly dashboard produced. Thresholds set but action is inconsistent. Some metrics not evaluated (just reported). Time to L3: 6–12 months.
- L3 (Managed). 30–50 metrics. Thresholds tied to corrective-action tickets. Trends analysed. Closure rate measured. Management review consumes the pack. The full 9.1 → 10.1 loop is operational. Time to L4: 12–18 months.
- L4 (Predictive). Real-time telemetry for capability metrics. Leading-indicator analysis (e.g., replication-lag trend predicts a future RTO breach). Supplier-performance scorecards. Predictive threshold setting (thresholds tuned based on historical variance). Time to L5: 18–24 months.
- L5 (Resilience by design). BCMS performance measurement is integrated with enterprise risk, operational, and technology performance. Predictive analytics forecast resilience posture under scenarios. Self-healing controls (the metric breaches, the system self-corrects before a human intervenes). BCMS performance reporting is real-time, board-level, and benchmarked externally.
Tools, Technologies, and Solutions
Clause 9.1 does not mandate specific tools. The choice depends on the size, complexity, and integration depth of the BCMS. The category-level landscape (no vendor names, per IP rules):
Tool categories
- Office-suite tools (Excel on SharePoint / Google Workspace). Acceptable at L1–L2 for organisations with <30 metrics and quarterly cadence. Strengths: zero additional cost, ubiquitous, easy to customise. Weaknesses: no automation, version-control discipline required, formulas error-prone, no audit trail. Free to existing licence cost.
- BI dashboards (category-level: "business-intelligence dashboard tool"). Suitable at L2–L3 for organisations with 30–60 metrics and mixed cadences. Strengths: visual, automated data feeds, trend analysis, threshold alerts. Indicative cost ₹1.5–6 lakh/year for a growing-company-segment licence.
- Mid-segment GRC SaaS (category-level: "mid-segment GRC SaaS"). Suitable at L2–L4 for organisations wanting BCM-aware templates, KPI libraries, and corrective-action workflows integrated with the measurement. Indicative cost ₹8–25 lakh/year.
- Enterprise IRM suite (category-level: "enterprise IRM suite"). Suitable at L4–L5 for large or regulated organisations wanting integrated risk, resilience, and compliance measurement on one platform. Indicative cost ₹40 lakh to several crore per year.
- BCM-specialist SaaS (category-level: "BCM-specialist SaaS"). Suitable for organisations whose primary need is BCMS-specific measurement (exercise management, BIA workflow, plan currency, supplier-BC test management). Indicative cost ₹10–35 lakh/year.
- System-telemetry tools. For capability metrics (replication health, backup success, failover latency), the underlying IT monitoring stack (APM, log management, infrastructure monitoring) is the source. These tools feed the BI dashboard or GRC SaaS. Indicative cost widely variable.
- Cyber-resilience measurement (SOC/SIEM-derived). For MTTD, MTTR, time-to-notify, the SOC's incident-handling system is the source of truth. Indicative cost widely variable.
- Specialist supplier-BC monitoring tools. For supplier-BC test pass rate, supplier-financial-health score, concentration-risk index, some GRC/IRM suites include modules; otherwise manual collection augmented with third-party financial-health feeds.
Tool selection criteria
Independent of category, the test for any 9.1 tool:
- Does it support the MMP as a controlled document? The MMP must be version-controlled under Clause 7.5; the tool must enforce this.
- Does it support defined formulas with audit trail? A change to a formula must be logged with date, person, and rationale.
- Does it support threshold-based alerting? Real-time or near-real-time notification of threshold breaches.
- Does it integrate with the corrective-action workflow? A breach should generate a ticket in the same system that manages Clause 10.1.
- Does it produce the audience-specific views? Operational / steering / executive / management-review / regulator-facing.
- Does it support trend analysis? Minimum four-quarter trend, ideally year-on-year.
- Does it integrate with the BIA / exercise / plan modules? The measurement system should not be detached from the operational BCMS modules; integration reduces double-entry and keeps the metric definitions aligned with the underlying artefacts.
- Does it evidence well for an auditor? Can the auditor see, for any metric, the definition, the data source, the values, the breaches, the actions, and the closure, in one place?
Indicative INR cost ranges by maturity
- L1 (office-suite only): ₹0–3 lakh/year (mostly labour; tooling is existing licence).
- L2 (BI dashboard + office-suite): ₹3–10 lakh/year (tooling ₹1.5–6 lakh; labour ₹1.5–4 lakh).
- L3 (mid-segment GRC SaaS or BCM-specialist SaaS): ₹15–40 lakh/year (tooling ₹8–25 lakh; labour ₹7–15 lakh).
- L4 (enterprise IRM suite with integration): ₹50 lakh–2 crore/year (tooling ₹40 lakh–1.5 crore; labour ₹10–50 lakh).
- L5 (enterprise IRM suite with predictive analytics and benchmarking): ₹80 lakh to several crore/year.
These are illustrative third-party cost ranges; they are not Singahi pricing.
The "buy vs build" decision
For most growing companies, the question is not whether to buy a tool but when. A typical journey:
- Year 1 (L1→L2): Excel on SharePoint. The discipline of defining metrics, setting thresholds, and producing a quarterly pack matters more than the tool. Many organisations fail at 9.1 not because they lack a tool but because they lack the discipline. Use the lowest-cost tool that forces the discipline.
- Year 2 (L2→L3): Migrate to a BI dashboard or a mid-segment GRC SaaS once the MMP is stable (metrics do not change quarter to quarter) and the volume of data justifies automation.
- Year 3+ (L3→L4): Move to an enterprise IRM suite when the integration cost (BIA, exercise, plan, supplier, corrective action) exceeds the cost of a unified platform.
Avoid the anti-pattern of buying an enterprise IRM suite at L1 maturity. The tool will not create the discipline; it will only document its absence.
Policy and Procedure Templates
Clause 9.1 requires three policy/procedure artefacts (full templates are in the toolkit):
BCMS Monitoring & Measurement Policy
A board-approved (or sponsor-approved) policy that establishes:
- The purpose and scope of the monitoring & measurement programme.
- The four principles (effect over activity; trend over point; threshold-tied; documented formulas).
- The roles and responsibilities (BCM owns; activity owners contribute; internal audit assures; top management consumes via 9.3).
- The minimum metric set (or a reference to the MMP).
- The threshold-band framework.
- The corrective-action linkage (Clause 10.1).
- The reporting cadence (operational / steering / executive / management review / regulator-facing).
- The annual review cycle for the policy itself.
Sample policy "shall" clauses (these are Singahi-drafted sample clauses, not the standard's text, the standard's text is paraphrased):
- "The organisation shall maintain a documented Monitoring & Measurement Plan listing all BCMS performance metrics, definitions, owners, sources, cadences, targets, and thresholds."
- "The BCM shall evaluate BCMS performance at planned intervals and report results to top management."
- "Any metric that crosses an amber or red threshold shall trigger a corrective-action ticket under the Corrective Action procedure within two working days."
- "Documented information of monitoring and measurement results shall be retained for a minimum of five years."
BCMS Monitoring & Measurement Procedure
A procedure (typically 8–12 pages) that operationalises the policy:
- Step 1: Maintain the MMP.
- Step 2: Collect data per the defined cadences.
- Step 3: Calculate metrics per the defined formulas.
- Step 4: Detect threshold breaches.
- Step 5: Open and manage corrective-action tickets.
- Step 6: Build the monthly / quarterly / annual packs.
- Step 7: Conduct the periodic evaluation (against Clause 6.2 objectives, regulatory minimums, trends, benchmarks).
- Step 8: Report to audiences (operational, steering, executive, management review, regulator).
- Step 9: Review and update the MMP annually.
- Step 10: Validate metric definitions annually.
KPI Definitions Sheet
A controlled document (under Clause 7.5) with one entry per metric, containing all 17 MMP columns (see §7.2). This is the artefact an auditor will request first; it is the single source of truth for what each metric means.
Risk Assessment and Treatment
The risks specific to a 9.1 programme, and their treatments:
| # | Risk | Likelihood | Impact | Treatment |
|---|---|---|---|---|
| RM-1 | Metric definition drift. Two people compute the metric differently; the trend becomes invalid. | High | High | Documented formulas; annual validation; version control on KPI definitions sheet; internal-audit test of definition consistency. |
| RM-2 | Vanity metrics. The programme measures activity (drills conducted) rather than effect (RTO achieved); the dashboard is green but the BCMS is weak. | High | High | Effect-over-activity principle in the policy; objective (Clause 6.2) traceability for every metric; steering-group challenge of any metric that does not map to an objective or risk. |
| RM-3 | Broken action loop. Measurements are taken, breaches are detected, but corrective actions are not opened or not closed. | Medium | Critical | Closure-rate KPI (target ≥85%); escalation path for actions open >90 days; quarterly steering review of open actions; explicit Clause 10.1 linkage. |
| RM-4 | Red suppression. A red metric is reclassified amber to avoid escalation. | Medium | Critical | Honesty principle in the policy; threshold defined in advance; auditor spot-checks; whistleblower route to internal audit. |
| RM-5 | Dashboard overload. 100 metrics, no analysis. The dashboard becomes unreadable. | Medium | Medium | Few-metrics principle; annual MMP review to retire low-value metrics; audience-specific views (operational / steering / executive). |
| RM-6 | Sampling error. Manual sampling (e.g., contact-list currency) is too small to be representative. | Medium | Medium | Defined sample size (statistical confidence); documented sampling method; periodic full-population check. |
| RM-7 | Tool dependence. Measurement stops when the tool is down or the licence lapses. | Low | High | Manual fallback (Excel) for critical metrics; defined recovery for the measurement system itself. |
| RM-8 | Regulatory misalignment. The metric set does not include regulator-required measurements (CERT-In 6-hour, IRDAI drill performance, SEBI MII RTO). | Medium | High | Annual regulatory-mapping check; the MMP includes a "regulatory hook" column. |
| RM-9 | Single-person dependence. The BCM is the only one who knows the formulas; departure breaks the programme. | Medium | High | KPI definitions sheet as controlled document; cross-training; deputy designation. |
| RM-10 | Stale MMP. The MMP was written three years ago and no longer reflects current objectives or risks. | High | Medium | Annual MMP review; change-triggered MMP update (when Clause 6.2 objectives change, when new regulation applies, when scope changes). |
The risk register should be reviewed at the annual programme review and updated when a threshold breach reveals a previously unidentified risk.
Audit and Compliance Checklist
The 25 questions a certification auditor (or a regulator's supervisor) is most likely to ask, with expected evidence and red flags. This is the pre-audit self-assessment.
| # | Question | Expected evidence | Red flag |
|---|---|---|---|
| 1 | Show me your Monitoring & Measurement Plan. | The MMP, controlled document under Clause 7.5; lists every metric with definition, owner, cadence, target, threshold. | No MMP, or an MMP that is a spreadsheet with no version control. |
| 2 | Pick a metric. Walk me through the definition. | KPI definitions sheet entry; the BCM can recite numerator, denominator, exclusions. | The BCM cannot recite the formula; two people give different formulas. |
| 3 | How do you ensure valid results? | Validation method described; validation records; metric-definition change log. | No validation step; definitions changed silently. |
| 4 | Show me the last four quarters of dashboards. | Quarterly packs dated, with values, trends, threshold status. | Missing quarters; metrics that appeared and vanished; trend line drawn without underlying data. |
| 5 | Pick a metric that crossed amber or red. What happened? | Threshold-breach record; corrective-action ticket; closure evidence. | Breach with no ticket; ticket open for >90 days with no escalation; closure without re-measurement. |
| 6 | What is your corrective-action closure rate? | KPI value (target ≥85%); trend. | Closure rate <70%; no measurement of closure rate at all. |
| 7 | What is your repeat-finding rate? | KPI value (target <10%); trend; analysis of repeats. | Repeat-finding rate >25%; not measured. |
| 8 | Show me the link from Clause 6.2 objectives to metrics. | Cross-reference matrix; every objective has at least one metric. | Objectives with no measurement; metrics with no objective. |
| 9 | Show me the link to Clause 9.3. | Management-review minutes referencing 9.1 outputs as input. | Management review conducted without 9.1 input; or with input but no decisions. |
| 10 | Show me the link to Clause 10.1. | Corrective-action tickets traceable from 9.1 breaches; closure evidence. | Breaches with no tickets; tickets with no closure; closure without re-measurement. |
| 11 | How do you measure RTO achievement? | Definition, data source (exercises + real incidents), calculation, four-quarter trend. | "RTO achievement" computed only from successful exercises (cherry-picking). |
| 12 | How do you measure time-to-notify (CERT-In 6-hour)? | Per-incident timestamps; mean and worst values; trend. | Assertion without measurement; measurement from a single incident. |
| 13 | How do you measure exercise effectiveness? | Exercise-pass rate (objectives met / objectives attempted); not just "exercise conducted." | Activity count only (number of drills). |
| 14 | How do you measure contact-list currency? | Sampling method, sample size, last check, % stale. | "We update it when someone leaves" with no measurement. |
| 15 | How do you measure supplier-BC capability? | Supplier-BC test pass rate; per critical supplier; cadence. | "We have it in contracts" with no testing. |
| 16 | How do you measure replication health? | Automated telemetry; threshold; breach history. | "The DR site is fine" with no telemetry. |
| 17 | How do you measure backup restore-success? | Restore tests (frequency, sample); pass rate. | "Backups run daily" with no restore tests. |
| 18 | How do you measure SPOF count? | Defined SPOF inventory for tier-1 activities; trend; reduction actions. | No SPOF inventory. |
| 19 | How do you measure the BCMS itself (governance metrics)? | Closure rate, repeat-finding rate, audit nonconformity trend. | Process metrics only; no governance metrics. |
| 20 | How do you evaluate BCMS performance? | Evaluation memo per cycle; judgement against objectives, regulatory minimums, trends, benchmarks. | Dashboards produced but no evaluation; numbers reported without judgement. |
| 21 | How do you retain documented information of results? | Defined retention period (e.g., 5 years); storage; retrieval test. | Retention undefined; data overwritten quarterly. |
| 22 | How do you communicate results to interested parties? | Communication plan; audience-specific views; cadence. | One pack sent to everyone; no audience tailoring. |
| 23 | How do you review and update the MMP? | Annual MMP review record; change-triggered updates. | MMP unchanged for years; no review record. |
| 24 | How does internal audit (9.2) interact with 9.1? | Audit of the measurement process; findings on metric definitions, validation, thresholds. | Internal audit never tests 9.1; or tests the numbers not the process. |
| 25 | How do you benchmark externally? | Use of BCI Horizon Scan, regulator-published data, sector surveys; documented comparison. | No external reference; the organisation grades its own homework. |
A defensible pre-audit self-assessment scores each question Red/Amber/Green and remediates all Reds before the audit window.
Metrics and KPIs
The full catalogue of 30 KPIs for a typical growing company. Each has a definition, formula, target, threshold band, cadence, owner, and reporting destination. The full definitions sheet (the toolkit document 11) is the controlled version; this is the summary.
Process metrics (KPIs 1–10)
| # | KPI | Formula | Target | Amber | Red | Cadence | Owner |
|---|---|---|---|---|---|---|---|
| 1 | Exercise schedule adherence % | (Exercises conducted on schedule ÷ exercises planned) × 100 | ≥95% | 85–95% | <85% | Quarterly | BCM |
| 2 | BIA-currency cycle adherence % | (Tier-1 activities reviewed in cycle ÷ tier-1 activities due) × 100 | 100% | 90–99% | <90% | Semi-annual | BCM |
| 3 | Plan-review currency % | (Plans reviewed within cadence ÷ plans due) × 100 | ≥95% | 85–95% | <85% | Quarterly | BCM |
| 4 | Training completion % | (Required staff trained ÷ required staff) × 100 | ≥95% | 85–95% | <85% | Quarterly | BCM + HR |
| 5 | Awareness-survey penetration % | (Staff completing awareness survey ÷ staff) × 100 | ≥80% | 60–80% | <60% | Annual | BCM + HR |
| 6 | Documented-information review cycle adherence % | (Documents reviewed ÷ documents due) × 100 | ≥95% | 85–95% | <85% | Annual | BCM |
| 7 | Policy review cycle adherence % | (Policies reviewed on cycle ÷ policies due) × 100 | 100% | 90–99% | <90% | Annual | BCM |
| 8 | BCM steering-group meeting cadence % | (Meetings held ÷ meetings scheduled) × 100 | 100% | 80–99% | <80% | Annual | Sponsor |
| 9 | Communication-cadence adherence % | (Comms sent per plan ÷ comms planned) × 100 | ≥95% | 85–95% | <85% | Quarterly | BCM |
| 10 | Exercise-action closure rate % | (Exercise actions closed ÷ actions due) × 100 | ≥85% | 70–85% | <70% | Quarterly | BCM |
Outcome metrics (KPIs 11–17)
| # | KPI | Formula | Target | Amber | Red | Cadence | Owner |
|---|---|---|---|---|---|---|---|
| 11 | RTO achievement % (exercises) | (Exercises where actual RTO ≤ target ÷ exercises) × 100 | ≥95% | 85–95% | <85% | Quarterly | BCM + IT/DR |
| 12 | RTO achievement % (real disruptions) | (Incidents where actual RTO ≤ target ÷ incidents) × 100 | ≥90% | 75–90% | <75% | Per incident + annual | BCM + IT/DR |
| 13 | RPO achievement % (exercises + real) | (Events where actual data loss ≤ RPO ÷ events) × 100 | ≥95% | 85–95% | <85% | Per event + annual | IT/DR |
| 14 | Time-to-activate BC response (minutes) | Mean elapsed time from incident declaration to BC team activation | ≤30 min | 30–60 | >60 | Per event + quarterly | BCM |
| 15 | Time-to-notify CERT-In (hours) | Mean elapsed from detection to CERT-In report | ≤6 hours | 6–8 | >8 | Per event + annual | CISO + BCM |
| 16 | Time-to-notify RBI/SEBI/IRDAI/DPDP Board | Per regulator's clock | Per clock | Per clock + 10% | Per clock + 25% | Per event | CISO + Compliance |
| 17 | Customer-facing availability during continuity events % | (Uptime during declared continuity events ÷ scheduled uptime) × 100 | Per SLA | SLA −2pp | SLA −5pp | Per event + annual | BCM + Service Owner |
Capability metrics (KPIs 18–24)
| # | KPI | Formula | Target | Amber | Red | Cadence | Owner |
|---|---|---|---|---|---|---|---|
| 18 | Replication health % | (Time replication within RPO ÷ total time) × 100 | ≥99% | 95–99% | <95% | Real-time + monthly | IT/DR |
| 19 | Backup restore-success rate % | (Successful restore tests ÷ restore tests attempted) × 100 | 100% | 95–99% | <95% | Monthly | IT/DR |
| 20 | DR site readiness % | (Readiness checks passed ÷ checks) × 100 | ≥95% | 85–95% | <85% | Monthly | IT/DR |
| 21 | Contact-list currency % | (Valid contacts ÷ total contacts sampled) × 100 | ≥98% | 90–98% | <90% | Monthly (sample) | BCM |
| 22 | Supplier-BC test pass rate % | (Critical suppliers passing BC test ÷ critical suppliers) × 100 | ≥95% | 85–95% | <85% | Annual | BCM + Procurement |
| 23 | SPOF count (tier-1 activities) | Count of SPOFs identified for tier-1 activities | Trend down | Flat | Rising | Annual | BCM + activity owners |
| 24 | Deputy-coverage % | (Tier-1 roles with deputy trained ÷ tier-1 roles) × 100 | 100% | 90–99% | <90% | Quarterly | BCM + HR |
Governance metrics (KPIs 25–30)
| # | KPI | Formula | Target | Amber | Red | Cadence | Owner |
|---|---|---|---|---|---|---|---|
| 25 | Corrective-action closure rate % | (Actions closed within window ÷ actions due) × 100 | ≥85% | 70–85% | <70% | Quarterly | BCM |
| 26 | Repeat-finding rate % | (Findings that are repeats ÷ total findings) × 100 | <10% | 10–25% | >25% | Annual | BCM + Internal Audit |
| 27 | Audit nonconformity count | Count of nonconformities from internal/external audit | Trend down | Flat | Rising | Per audit + annual | BCM |
| 28 | Management-review action closure % | (9.3 actions closed ÷ actions due) × 100 | ≥90% | 75–90% | <75% | Annual | Sponsor |
| 29 | Regulatory-reporting timeliness % | (Reports filed within clock ÷ reports due) × 100 | 100% | 95–99% | <95% | Per event + annual | Compliance |
| 30 | Programme maturity score | Annual self-assessment score (L1–L5 scale) | Trend up | Flat | Falling | Annual | BCM + Sponsor |
Dashboard principles
- One page per audience. The operational view, the steering view, the executive view, the management-review view, and the regulator-facing view are separate one-pagers.
- RAG with trend. Every RAG status is paired with a four-quarter trend line.
- Threshold band visible. The green/amber/red bands are marked on the trend chart.
- Open actions listed. The dashboard shows the open corrective actions on amber/red metrics, with owner and age.
- Honest. A red metric is shown red. Suppression is a discipline failure.
Common Pitfalls / Audit Failures
The named, memorable anti-patterns that cause 9.1 to fail. Each is a real finding pattern.
"Vanity metrics", measuring activity, not effect
The organisation reports "12 exercises conducted, 8 plans updated, 4 trainings delivered." These are activity counts. The auditor will ask: "What was the RTO achievement in those 12 exercises? What was the pass rate? What changed in the plans, and was the change validated?" An activity-only dashboard is the most common 9.1 finding. Treatment: restate every metric as an effect metric (achievement, pass rate, currency).
"The forever-green dashboard"
The dashboard has shown all-green for eight consecutive quarters. The auditor's response: "Show me a metric that went red. If nothing ever goes red, you are not measuring anything that matters." A forever-green dashboard is a measurement failure (the thresholds are too loose, or the data is being smoothed, or the metrics are vanity). Treatment: tighten thresholds until at least one metric goes amber per quarter; investigate every "should-be-red-but-is-not" case.
"Two formulas, one metric"
The BCM computes "RTO achievement %" from exercise data; the IT/DR lead computes it from real incident data; the two never reconcile. The trend line is invalid. The auditor's test: ask two people to compute the metric independently. Treatment: the KPI definitions sheet is the single source of truth; version control; annual validation.
"The broken loop"
Breaches are detected, tickets are opened, and the tickets age. The closure rate is 50%. The auditor traces a breach from two quarters ago and finds the ticket still open with no escalation. Treatment: closure rate as a KPI (target ≥85%); escalation at 60 days; steering-group review at 90 days.
"Cherry-picked measurements"
RTO achievement is computed only from successful exercises; the failed exercise (the one that ran 2.5× RTO) is excluded as "not representative." The auditor will find the failed exercise in the exercise log and find the exclusion. Treatment: every exercise and every real disruption is included; outliers are noted, not excluded.
"Retrospective thresholds"
"This quarter we hit 60%, so let's call amber 55%." Thresholds set after the measurement are not thresholds. The auditor compares this quarter's thresholds to last quarter's; changes without version control are a finding. Treatment: thresholds set in advance, in writing, in the MMP; changes logged with rationale.
"The unread dashboard"
The 80-page quarterly pack is emailed to 30 people; no one reads it. The steering group meets without referencing the pack. The auditor asks a steering-group member about a red metric; they have not seen it. Treatment: one-page audience-specific views; the steering group's standing agenda opens with the dashboard.
"No objective traceability"
The organisation has 40 metrics and 5 BC objectives, but no one can map which metric supports which objective. The auditor picks an objective and asks "what is the current measurement?", silence. Treatment: the MMP includes a Clause 6.2 objective column; the evaluation memo organises results by objective.
"The unmeasured regulator clock"
The organisation is CERT-In-regulated (6-hour reporting) but does not measure time-to-notify. When a real incident occurs, the regulator asks for the timestamp record; the organisation can produce only an assertion. Treatment: time-to-notify as a KPI from the start; per-incident timestamps.
"Tool-led, not discipline-led"
The organisation bought an enterprise IRM suite before defining its metrics. The tool's default metric library became the organisation's metric set; none of the metrics map to the BC objectives. The dashboard is full but meaningless. Treatment: define the MMP first; then choose the tool that supports it.
"The vanishing metric"
A metric appeared for two quarters (when a particular consultant ran the programme) and then vanished. The auditor treats vanishing metrics as evidence that the programme is a person, not an institution. Treatment: the MMP is a controlled document; metrics are retired through a defined process with rationale, not by absence.
"Measurement without evaluation"
The dashboard is produced. The evaluation memo is not. The auditor asks: "Given these results, what is your judgement of BCMS performance?" No documented answer. Treatment: evaluation is a separate artefact from measurement; the evaluation memo is required for each cycle.
Illustrative Scenario 1: Failure
Illustrative scenario, a composite example for guidance, not a specific Singahi engagement or a verified outcome.
Illustrative scenario. This composite is drawn from publicly disclosed Indian incidents and patterns observed in BCM audits. It is illustrative and does not name or accurately describe any specific organisation.
The organisation. A mid-market Indian fintech (approximately 1,200 employees, ~₹850 crore annual revenue) serving as a payment aggregator for several large e-commerce platforms. RBI-regulated as a Payment System Operator; subject to the RBI Master Direction on IT Governance (7 November 2023) and CERT-In Directions. The fintech had recently completed Stage 2 of an ISO 22301 certification audit with three minor nonconformities, two of which were against Clause 9.1.
The setup. The BCM (a former IT project manager, two years in role) maintained a 45-metric dashboard on Excel on SharePoint. The dashboard was produced quarterly and distributed to a steering group of seven. The BCM had inherited the metric set from a predecessor and had not reviewed it in the current year. Four metrics had been "frozen", same value for six consecutive quarters, because no one had updated the underlying data.
The incident. On a Saturday in late October, the fintech's primary payment-switch connector to a major card network failed during a festive-season sale peak. The failover to the secondary connector, which had been tested in a tabletop exercise eight months earlier, did not work: the secondary connector's API credentials had been rotated by the card network 11 weeks earlier, and no one at the fintech had updated them. Transaction failures accumulated for 4 hours 20 minutes before the incident was declared; restoration took another 6 hours 15 minutes. The total payment downtime was 10 hours 35 minutes against a stated RTO of 2 hours. Roughly ₹14 crore of transactions were affected; the e-commerce platforms invoked their SLA penalties.
The 9.1 failures, traced post-incident. A subsequent review (commissioned by the board Risk Committee after the RBI supervisor requested an explanation) identified five Clause 9.1 failures:
- Unmeasured supplier-BC parameter. The card-network connector was a critical supplier dependency, but "supplier-BC test pass rate" did not include the connector. The KPI existed; the scope was wrong. The metric had been green for six quarters.
- Frozen metric. The "contact-list currency" metric had shown 99% for six quarters because the underlying SharePoint list had not been updated, the metric was measuring the SharePoint file's modification date, not actual contact validity. Several contacts on the response list had left the organisation.
- Time-to-notify measured from the wrong point. "Time-to-notify CERT-In" was measured from incident declaration (Saturday 14:25) rather than from incident detection (Saturday 10:05). The reported 4-hour time-to-notify was actually 8 hours 20 minutes, a CERT-In non-compliance.
- No threshold on RTO achievement for real disruptions. The MMP had a threshold for exercises (95%) but no threshold for real disruptions. The 10-hour-35-minute actual RTO did not trigger any ticket because no threshold was breached (because no threshold existed).
- Broken action loop. A similar (smaller) connector-credential failure had occurred seven months earlier; a corrective action to automate credential-rotation alerts had been opened; the ticket had aged without escalation; the corrective action had not been implemented. Closure rate at the time of the incident: 58%.
The consequences. The RBI supervisor issued a letter requiring the fintech to (a) commission an independent review of its BCMS measurement programme, (b) submit a remediation plan within 30 days, (c) freeze the launch of two new payment products pending remediation, and (d) report quarterly on BCMS performance to the board Risk Committee for the next four quarters. The fintech's ISO 22301 surveillance audit resulted in a major nonconformity against Clause 9.1 (the measurement process was not producing valid results). The CISO departed. The total cost (SLA penalties, remediation consulting, tool investment, lost product-launch revenue, FTE) was estimated internally at ₹18–22 crore.
The lessons. The five failures trace cleanly to the named anti-patterns: vanity metrics (supplier-BC scoped to exclude the critical dependency), the frozen metric, the broken loop (closure rate 58%), unmeasured regulator clock, and missing threshold. The single most diagnostic finding was the closure rate: 58% meant that the measurement-to-action loop had been broken for at least two quarters before the incident. The 9.1 programme had been producing dashboards; it had not been producing decisions. The recurrence of a known failure pattern (credential rotation) was the signature of a broken 9.1 loop.
Illustrative Scenario 2: Success
Illustrative scenario. This composite is drawn from publicly disclosed Indian improvements and patterns observed in BCM programme transformations. It is illustrative.
The organisation. A Tier-2 Indian auto-components manufacturer (approximately 3,400 employees, ~₹1,800 crore annual revenue) with four plants in Maharashtra and Tamil Nadu, supplying two-wheeler and passenger-vehicle OEMs. Subject to NDMA Chemical Disaster Guidelines 2007 (one plant is a Major Accident Hazard unit), the Factories Act 1948, and DPDP Act 2023 (employee and supplier data). The manufacturer had been ISO 22301 certified for three years but at low maturity (L2); measurement was Excel-based, and the BCM (a Quality-team member with a part-time BCM remit) produced an annual pack that no one read.
The catalyst. A flash flood at the Tamil Nadu plant in early December (a North-East monsoon event heavier than the 2015 Chennai floods the plant had previously withstood) put the plant's paint shop under 80 cm of water for 36 hours. The plant was down for 11 days. The OEM customers, two of which had single-source relationships with the plant, invoked business-interruption clauses. The estimated revenue impact was ₹42 crore; the insurance claim process took 14 months.
The response. The board, shaken, commissioned a BCMS upgrade. The COO sponsored a 24-month programme to move the measurement discipline from L2 to L4. The programme had four pillars:
- A redesigned MMP, owned by a full-time BCM. The new BCM (a BCI-certified lead practitioner hired from outside) rebuilt the MMP from scratch with 38 metrics, each with a documented definition, an objective traceability column, a threshold band, and an action trigger. The metric set included plant-specific capability metrics (paint-shop power redundancy, dewatering-pump readiness, alternative-curing-furnace availability) that had never been measured before.
- A BI dashboard on a mid-segment GRC SaaS. The Excel pack was retired; a BI dashboard was built on a mid-segment GRC SaaS with automated feeds from the plant SCADA, the IT monitoring stack, and the supplier-management module. The dashboard had four audience views: plant operations, BCM steering, executive committee, board Risk Committee.
- A closed-loop corrective-action workflow. Every threshold breach generated a ticket in the same system; escalation at 30/60/90 days; weekly review by the BCM; monthly review by the steering group. The closure rate became the headline KPI of the programme itself.
- A monsoon-preparedness sub-programme. A dedicated set of metrics ran from May to November each year, tracking the plant's monsoon readiness (dewatering-pump tests, alternative-drainage readiness, sandbag inventory, satellite-weather monitoring, OEM-communication readiness). The metrics were leading indicators of plant survivability under the next monsoon.
The investment. Over 24 months: full-time BCM ₹38 lakh (salary plus benefits plus certification); GRC SaaS ₹19 lakh (two-year subscription); integration with SCADA and IT monitoring ₹28 lakh (one-time); BI dashboard build ₹14 lakh (one-time); annual validation and external benchmarking ₹6 lakh per year. Total: ₹99 lakh one-time plus ₹44 lakh per year ongoing (₹1.43 crore one-time + first-year ongoing). Roughly ₹420 per employee per year ongoing.
The results (24 months in). The programme produced measurable change:
- RTO achievement in exercises moved from 71% (baseline) to 94% (24 months), with the plant-specific scenarios (flood, fire, supplier failure, power outage, IT outage) all above 90%.
- Supplier-BC test pass rate moved from 48% (baseline) to 88% (24 months). The supplier base of 187 was rationalised to 142 (de-risking through dual-sourcing of 14 critical components).
- SPOF count for tier-1 activities fell from 31 (baseline) to 12 (24 months), driven primarily by cross-training, deputy-designation, and dual-sourcing.
- Corrective-action closure rate moved from 62% (baseline) to 91% (24 months). The "broken loop" anti-pattern was the primary target; the closure-rate KPI was reported to the board Risk Committee monthly.
- Repeat-finding rate moved from 34% (baseline) to 8% (24 months). The monsoon-preparedness sub-programme produced zero recurrence of the dewatering-pump failure that had contributed to the original flood impact.
- Time-to-activate the BC response (across all plants) fell from a mean of 4 hours 12 minutes (baseline) to 38 minutes (24 months), driven by a redesigned activation protocol and a mass-notification tool.
The ROI. The COO presented the ROI to the board at month 24, using a conservative scenario: a single flood-event of the same magnitude as the catalyst, averted or contained by the improved measurement and resulting corrective actions. Estimated gross loss avoided: ₹42 crore (the original impact). Programme cost over 24 months: ₹1.87 crore (one-time plus two years ongoing). ROI on the conservative single-event scenario: 22× (gross loss avoided ÷ programme cost). On a more realistic five-year horizon assuming one averted or contained event and ongoing efficiency gains (lower insurance premia, fewer OEM penalties, lower crisis-consulting spend, lower audit findings), the board accepted a 7–10× ROI estimate.
The intangibles. The board Risk Committee, which had previously reviewed BCM annually as a compliance formality, now reviewed BCMS performance quarterly and asked informed questions. The OEM customers, two of which had moved to dual-source after the original flood, returned to single-source with the manufacturer on the strength of the measured improvement. The insurer reduced the premium at renewal by 11%, citing the documented measurement programme. The manufacturer's next ISO 22301 surveillance audit recorded zero nonconformities against Clause 9.1 and a noted strength in the closure-rate discipline.
The lessons. The transformation succeeded because the measurement discipline came first and the tool second; because the BCM was full-time and certified; because the closure rate was treated as the headline KPI; because the metric set was rebuilt for the organisation's actual risk profile (plant-specific, flood-aware) rather than inherited; and because the board consumed the dashboard and made decisions on it. The programme is the illustration of the principle: a BCMS that measures honestly, evaluates bravely, and corrects rigorously is a BCMS that improves.
Multi-Framework Mapping
Clause 9.1 maps to the measurement/evaluation requirements of every major resilience framework. This mapping uses real control numbers.
ISO 22301 ↔ ISO/IEC 27001:2022
| ISO 22301:2019 | ISO/IEC 27001:2022 | Notes |
|---|---|---|
| 9.1 (this clause) | Clause 9.1 (Monitoring, measurement, analysis and evaluation) | Identical structure (Harmonised Structure); ISMS performance is measured under 27001 9.1; BCMS performance under 22301 9.1. An integrated ISMS+BCMS runs one measurement programme covering both. |
| 9.1 | A.5.29 Information security during disruption | A.5.29 response controls generate the event data 9.1 measures (time-to-respond, RTO achieved). |
| 9.1 | A.5.30 ICT readiness for business continuity | A.5.30 requires that ICT readiness for continuity be tested regularly, the tests generate the RTO/RPO achievement measurements 9.1 evaluates. |
| 9.1 | A.8.13 Information backup | A.8.13 backup controls generate the restore-success-rate metric 9.1 measures. |
| 9.1 | A.8.14 Redundancy of information processing facilities | A.8.14 redundancy controls generate the SPOF-count and failover-readiness metrics. |
ISO 22301 ↔ SOC 2
| ISO 22301:2019 | SOC 2 (2017 With Revised Points of Focus, plus AICPA 2022 Trust Services Criteria) | Notes |
|---|---|---|
| 9.1 | Availability (A) criteria, particularly CC7.1 (detection and monitoring), CC7.2 (incident detection), CC7.3 (incident evaluation), CC7.4 (recovery), A1.2 (environmental protections), A1.3 (recovery infrastructure) | SOC 2 Availability controls are deeply measurement-oriented; the points of focus for CC7 and A1 are largely a 9.1 measurement catalogue. A SOC 2 Availability audit and an ISO 22301 surveillance audit consume much of the same evidence. |
ISO 22301 ↔ NIST SP 800-34 Rev 1
| ISO 22301:2019 | NIST SP 800-34 Rev 1 (May 2010) | Notes |
|---|---|---|
| 9.1 | Step 6 (Plan testing, training & exercises); Step 7 (Plan maintenance) | SP 800-34's seven-step contingency planning process embeds measurement in steps 6 and 7, testing and maintenance are the operational expressions of 9.1 measurement for an information-system contingency plan. |
ISO 22301 ↔ NIST CSF 2.0
| ISO 22301:2019 | NIST CSF 2.0 (26 February 2024) | Notes |
|---|---|---|
| 9.1 | Recover function, RC.RP (recovery plan execution), RC.CO (recovery communication), RC.IM (recovery improvement) | RC.IM (lessons learned fed back) is the CSF's expression of the 9.1 + 10.1 loop. The Govern function (new in CSF 2.0) ≈ ISO 22301 Clause 5 + 9.3 measurement governance. |
ISO 22301 ↔ DORA (Regulation (EU) 2022/2554)
| ISO 22301:2019 | DORA article | Notes |
|---|---|---|
| 9.1 | Art 11(6), yearly testing of BCPs; Art 13, learning and evolving (post-incident review); Art 17–23, incident classification and reporting (the time-to-notify metrics); Art 24–27, digital operational resilience testing programme (the exercise-derived measurements); Art 26, TLPT every 3 years | DORA is heavily measurement-driven; an in-scope financial entity's 9.1 programme is the substrate for its DORA testing, incident-reporting, and learning obligations. Indian IT/BPO firms serving EU financial entities inherit these measurement obligations contractually. |
ISO 22301 ↔ APRA CPS 230
| ISO 22301:2019 | APRA CPS 230 (effective 1 July 2025) | Notes |
|---|---|---|
| 9.1 | Para 33 (notify APRA ≤72 hours of material incident); Para 42 (notify APRA ≤24 hours of critical-operation disruption outside tolerance); Para 43 (annual business-continuity exercise); Para 46 (internal audit review of BCM) | CPS 230's notification clocks and exercise cadence are the regulator-specified measurement points that a 9.1 programme must capture for in-scope APRA entities. Para 38's tolerance triple (max disruption period, max data loss, min service levels) is the APRA equivalent of the MTPD/RPO/MBCO baseline that 9.1 measures against. |
ISO 22301 ↔ FFIEC BCM Booklet (Nov 2019)
| ISO 22301:2019 | FFIEC BCM Booklet | Notes |
|---|---|---|
| 9.1 | Examination procedures, particularly the "Testing" and "Maintenance" sections | The FFIEC BCM examination procedures are, in effect, a 9.1 audit checklist for US banks; an ISO 22301-certified US bank can map FFIEC examination items to 9.1 with minimal loss. |
ISO 22301 ↔ Indian regulators (summary)
| ISO 22301:2019 | Indian instrument | Notes |
|---|---|---|
| 9.1 | RBI Master Direction on IT Governance (7 Nov 2023) | Board review of BCP/DR performance; IT-service-continuity metrics; SLA monitoring; the supervisory expectation that digital-outage recurrence is a governance failure traceable to a broken measurement loop. |
| 9.1 | RBI Cyber Security Framework in Banks (2 Jun 2016) | 24x7 SOC measurement; ALM-style resilience baseline; the 2–6 hour incident-reporting clock. |
| 9.1 | SEBI CSCRF (20 Aug 2024) | "Detect" function (continuous measurement) and "Learn" function (post-incident measurement); KPI reporting for SEBI REs by category. |
| 9.1 | SEBI BCP/DR for MIIs (22 Mar 2021) | RTO/RPO measurement; live/parallel DR drill performance reporting. |
| 9.1 | IRDAI Info & Cyber Guidelines 2023 | Annual compliance reporting (the regulator-facing evaluation); DR drill performance; 180-day log retention as measurement substrate. |
| 9.1 | CERT-In Directions (28 Apr 2022) | 6-hour incident report (the time-to-notify metric); 180-day log retention (evidentiary substrate); NTP clock-sync (timestamp validity). |
| 9.1 | DPDP Act 2023 §8(5)/(6) + DPDP Rules 2025 | Availability measurement; breach-notification time-to-Board (72 hours) and time-to-affected-principals ("without delay"). |
| 9.1 | Companies Act 2013 §134(3)(n)/§177 + SEBI LODR Reg. 21 | Board risk-oversight; risk-register measurement for listed companies. |
A practical implication: an Indian regulated entity running a strong ISO 22301 9.1 programme satisfies a substantial portion of its regulatory measurement burden simultaneously. The MMP's "regulatory hook" column should make this explicit.
Implementation Roadmap
A 30/90/180/365-day roadmap from L1 to L3, with the Year 2 and Year 3 horizon to L4–L5.
First 30 days (foundational)
- Day 1–5: Charter the programme. Sponsor approval. BCM designated. (Owner: Sponsor + BCM)
- Day 6–15: Inventory current state. Pull existing dashboards, metric definitions, audit findings on 9.1, regulatory-reporting records. Identify the gaps (vanity metrics, frozen metrics, missing thresholds). (Owner: BCM)
- Day 16–25: Draft the MMP with the minimum defensible 20-metric set. Each metric has a draft definition, owner, cadence, target. (Owner: BCM + activity owners)
- Day 26–30: Draft the BCMS Monitoring & Measurement Policy and Procedure (toolkit 01, 02). Circulate for review. (Owner: BCM)
Days 31–90 (defined)
- Approve the Policy, Procedure, and MMP. Communicate the programme to all activity owners.
- Build the first dashboard (Excel or BI tool) with the 20 metrics. Validate that the data sources exist and the formulas compute.
- Run the first monthly operational review. Run the first quarterly steering-group review.
- Open the first corrective-action tickets from threshold breaches. Test the loop.
- Conduct the first internal mini-audit of the measurement process (a single metric, end-to-end).
- (Owner: BCM + activity owners + internal audit)
Days 91–180 (managed)
- Expand the metric set to 30–40 metrics as the programme stabilises.
- Migrate from Excel to a BI dashboard or a mid-segment GRC SaaS if the volume justifies.
- Build the audience-specific views (operational, steering, executive).
- Establish the threshold-breach ticket workflow with 30/60/90-day escalation.
- Begin trend analysis (first four-quarter trend line possible at Q4).
- Conduct the first evaluation memo (a documented judgement of BCMS performance against objectives, regulatory minimums, and trends).
- Begin the annual MMP review cycle.
- (Owner: BCM + Sponsor)
Days 181–365 (embedded)
- Run the first full management review (Clause 9.3) consuming the 9.1 pack as primary input.
- Conduct the first internal audit (Clause 9.2) of the measurement process. Remediate findings.
- Validate every metric definition (annual validation cycle).
- Add the supplier-BC test pass rate and the SPOF count to the metric set if not already present.
- Benchmark against external data (BCI Horizon Scan, regulator-published data).
- Maturity self-assessment: target L3 by end of Year 1.
- (Owner: BCM + Internal Audit + Sponsor)
Year 2 (L3 to L4)
- Real-time telemetry for capability metrics (replication, backup, DR site readiness).
- Predictive threshold setting (thresholds tuned on historical variance).
- Leading-indicator analysis (replication-lag trend predicts RTO breach; supplier-financial-health score predicts supplier-BC failure).
- Supplier-performance scorecards for top 20 critical suppliers.
- Integration with enterprise risk register (Clause 6.1).
- Annual programme review; maturity self-assessment; target L4 by end of Year 2.
Year 3+ (L4 to L5)
- Integrated BCMS / ERM / operational-risk measurement on a single IRM platform.
- Predictive analytics forecasting resilience posture under scenarios.
- Self-healing controls (metric breaches trigger automated remediation where feasible).
- External benchmarking with peer organisations (anonymised).
- Real-time board-level reporting.
- Continual-improvement cadence that pushes the maturity frontier each year.
FAQ
Q1. We are a 150-person SaaS company. Do we really need 30 KPIs? No. The 30-KPI catalogue is a reference set. A defensible 9.1 programme for a 150-person firm can run on 15–20 well-chosen metrics. The four tests in §2.1 (maps to an objective or regulatory duty; materially affected by BCMS work; measurable at acceptable cost; actionable) are the filter. Start with 15; add as the programme matures.
Q2. Our board does not read the dashboard. What do we do? Redesign the board view. The board view is one page, RAG status per objective, top three risks, top three actions, regulatory posture, one trend chart. If the board still does not read it, the BCM should attend the board Risk Committee meeting and present the one-page view verbally. A dashboard that is not consumed is a discipline failure on either the design or the consumption side; fix it.
Q3. Our internal audit team says they audit the BCMS, not the measurement. Is that right? Half-right. Internal audit (Clause 9.2) audits the BCMS for conformity and effective implementation. The measurement process (Clause 9.1) is part of the BCMS; internal audit should test it, are the definitions valid, are the thresholds set in advance, are breaches triggering actions, is the closure rate acceptable. Internal audit should not recompute every metric (that is management's job under 9.1); they should test the system of measurement.
Q4. Our corrective-action closure rate is 60%. The BCM says the actions are unreasonable. What do we do? A 60% closure rate is a red metric. Two diagnoses: either the actions are genuinely unreasonable (scope too broad, target date too tight, owner not resourced), or the BCM is right that the actions are unreasonable but the finding that generated them is valid. In either case, the action-loop is broken. Treatment: review every open action; re-scope unreasonable actions; close invalid actions with documented rationale; commit to a 75% target in 90 days and 85% in 180 days. The closure rate is the headline KPI; it must move.
Q5. We measure time-to-notify CERT-In, but we have not had a reportable incident in 18 months. How do we measure something that does not happen? You measure the capability, not the event. Run a tabletop exercise whose scenario is a CERT-In-reportable incident; measure time-to-notify from the exercise. The exercise is the proxy for the event. The same applies to RTO achievement, time-to-activate, and the other outcome metrics, exercises and drills are the principal source of outcome measurements in periods without real disruptions.
Q6. Our ERP system was re-platformed last quarter. Do we need to revisit the MMP? Yes. A re-platforming is a significant change (under Clause 6.3 and Clause 8.6) that triggers a 9.1 MMP review. The metric definitions that referenced the old ERP (e.g., "order-to-cash availability") may need re-baselining; the data sources may have changed; the RTO/RPO targets may need revalidation. Treat the change as a 9.1 trigger, document the review, and update the MMP under version control.
Q7. Our regulator (RBI / SEBI / IRDAI) has asked for our BCMS performance metrics. What do we send? The regulator-facing view from the dashboard (one page), the last annual evaluation memo, the MMP (as evidence of the measurement system), and any regulator-specific metrics (CERT-In time-to-notify trend, RTO achievement for SEBI MII, DR drill performance for IRDAI). Do not send the full quarterly pack, the regulator wants the evaluation, not the measurement. Send the judgement and the headline evidence.
Q8. We have ISO 27001 already. Can we extend the 27001 9.1 programme to cover 22301? Substantially, yes. ISO 27001 and ISO 22301 share the Harmonised Structure; Clause 9.1 has the same title and structure in both. An integrated ISMS+BCMS measurement programme is the efficient model. The differences: ISO 22301's metric set includes BC-specific parameters (RTO achievement, exercise pass rate, contact-list currency, supplier-BC test pass rate) that ISO 27001's does not. Build the BC layer on the existing ISMS measurement base; do not duplicate.
Q9. Our BCM left last month. The dashboard stopped. What do we do? This is a single-person-dependence failure (anti-pattern §3.10). Treatment: the MMP, the KPI definitions sheet, and the dashboard must be controlled documents (Clause 7.5) that survive personnel change. Re-start the dashboard from the MMP; assign an interim BCM (the CISO or the head of IT operations); recruit a replacement; cross-train going forward so the programme is not a person.
Q10. Our auditor says our metric definitions are unclear. We disagree. Who is right? The auditor's test is objective: two competent people, given the definition, must compute the same number. If the auditor can show that two people computed the metric differently, the definition is unclear by the standard of the clause ("methods … to ensure valid results"). Tighten the definition: numerator, denominator, inclusions, exclusions, worked example. Re-validate annually.
Q11. How is 9.1 different from 8.6? 8.6 is the operational evaluation of BC documentation and capabilities (a BIA, a plan, a DR site), narrower, focused on specific artefacts, scheduled and triggered by events. 9.1 is the system-wide instrumentation of the BCMS, broader, continuous, the dashboard by which the whole programme is steered. 8.6 findings are an input to 9.1 (a 8.6 corrective action becomes a 9.1 governance metric). An organisation with strong 8.6 but weak 9.1 evaluates its documents but cannot tell, system-wide, whether the BCMS is improving.
Q12. Our sponsor refuses to set thresholds ("we do not want to fail anything on paper"). What do we do? This is a sponsorship failure. The clause requires evaluation against objectives and thresholds; a programme without thresholds is not a compliant 9.1 programme. Education: thresholds are not "failure", they are information. A red metric is a successful evaluation that found a real issue. Frame thresholds to the sponsor as "early warning, not failure report." If the sponsor still refuses, document the constraint and raise it at the management review (Clause 9.3), the auditor will find it.
Industry-Specific Requirements
BFSI (banks, NBFCs, payment system operators)
The most prescriptive continuity-measurement regime in India. RBI Master Direction on IT Governance (7 Nov 2023) requires board-approved BCP/DR with documented RTO/RPO, DRS failover, periodic drills, outsourcing continuity controls, and IT readiness for crisis events. The RBI Cyber Security Framework (2016) requires the SOC, the ALM-style resilience baseline, and 2–6 hour incident reporting. Specific 9.1 metrics that BFSI must measure:
- Per-system availability (vs SLA and regulatory minimum).
- RTO/RPO achievement in DR drills (SEBI-style live/parallel failover expectations increasingly inform RBI supervisory practice for banks with MII interfaces).
- Time-to-notify RBI (per the RBI incident-reporting clock) and CERT-In (6 hours).
- Supplier performance for outsourced IT (RBI Master Direction on Outsourcing of IT Services, 10 Apr 2023).
- Digital-outage recurrence (the supervisory trigger for product-freeze actions).
Capital markets (MIIs, brokers, AMCs)
SEBI CSCRF (20 Aug 2024) defines the resilience regime. MIIs additionally operate under SEBI BCP/DR (22 Mar 2021) with RTO ≤2 hours for critical systems, Near Site + DRS architecture, and live/parallel DR drills. Specific 9.1 metrics:
- RTO achievement for critical MII systems (target ≤2 hours).
- RPO achievement (per the MII BCP/DR definition).
- Live-failover DR drill performance (annual, reported to SEBI).
- Cyber-resilience posture across the six CSCRF functions (Identify / Protect / Detect / Respond / Recover / Learn).
- Time-to-notify SEBI and CERT-In (6 hours).
Insurance
IRDAI Information and Cyber Security Guidelines 2023 (24 Apr 2023) require board-approved BCP/DR policy, CISO, 180-day logs, vulnerability assessment and pen-testing, DR drills, data locality, incident reporting, ICT outsourcing oversight, and annual compliance reporting within 90 days of FY end. Specific 9.1 metrics:
- DR drill performance.
- Annual compliance reporting cycle adherence.
- Time-to-notify IRDAI and CERT-In.
- Board Risk/IT Committee oversight cadence.
- ICT-outsourcing continuity oversight (per the IRDAI outsourcing guidelines).
Healthcare
Hospitals, diagnostics, and health-tech operate under the Clinical Establishments Act (where applicable state-level), NABH accreditation standards, the DPDP Act (health data is sensitive, Significant Data Fiduciary duties potentially engaged), and the NDMA framework for hospital-disaster planning. Specific 9.1 metrics:
- Critical-care availability during disruptions (MBCO at the bed / ICU / OT level).
- Time-to-activate the hospital disaster plan.
- HIS (hospital information system) availability and recovery.
- Patient-data availability (DPDP §8(5)).
- Time-to-notify DPDP Board for personal-data breaches (72 hours).
IT / ITeS & SaaS
Indian IT services and SaaS firms serving global clients inherit client continuity requirements contractually and, where the client is an EU financial entity, DORA obligations (Art 11 BIA, Art 12 RTO/RPO, Art 17–23 incident reporting, Art 26 TLPT every 3 years). Specific 9.1 metrics:
- Per-client RTO/RPO achievement.
- DORA-aligned incident-reporting metrics (where serving EU financial entities).
- Supplier-BC performance (the SaaS firm is a supplier; it must measure its own BC and report to clients).
- Time-to-notify clients (per contractual clocks).
Manufacturing, energy, chemicals, pharma
NDMA Chemical Disaster Guidelines 2007, the Factories Act 1948, PESO and CPCB regulations, and sector-specific standards impose continuity-measurement obligations on Major Accident Hazard units. Specific 9.1 metrics:
- Safety-critical parameter monitoring (the substrate that 9.1 evaluates).
- Time-to-activate on-site and off-site emergency plans.
- Mutual-aid response time.
- Plant-level RTO for tier-1 production activities.
- Environmental-continuity metrics (effluent continuity, emissions monitoring during disruptions).
Government and PSUs
NDMA guidelines, the National Policy on Disaster Management 2009, the DMP template (2014), and CAG audit expectations. Specific 9.1 metrics:
- Departmental DMP currency.
- Inter-departmental exercise performance.
- Critical-public-service availability during disruptions.
- CAG audit closure of continuity-related findings.
Maturity Model
The L1–L5 maturity model for Clause 9.1, with INR investment estimates per level (illustrative third-party cost ranges, mostly labour plus tooling, for a 250–2,000-person growing company).
Level 1, Ad hoc / reactive
- Practice. No MMP. Activity counts in the annual report. No thresholds, no trends, no evaluation memo. Real disruptions prompt ad hoc reviews; no structured post-incident measurement.
- Tools. Excel on SharePoint; ad hoc.
- Cost (annual). ₹0–3 lakh (existing FTE; existing office-suite licence).
- Audit outcome. Major nonconformity likely. The 9.1 programme is the absence of a programme.
- Path to L2. 6–9 months: charter, MMP, minimum metric set, first dashboard, first evaluation memo.
Level 2, Defined
- Practice. An MMP exists (20–30 metrics). KPI definitions documented. Quarterly dashboard produced. Thresholds set but action inconsistent. Some metrics not evaluated. Annual evaluation memo exists but may be a compliance formality.
- Tools. Excel on SharePoint with structured templates; or a basic BI dashboard.
- Cost (annual). ₹8–18 lakh (0.3–0.5 FTE ₹6–12 lakh; tooling ₹2–6 lakh).
- Audit outcome. Minor nonconformities likely on threshold-action linkage and metric validation. Survives surveillance with corrections.
- Path to L3. 6–12 months: threshold-breach ticket workflow; closure-rate KPI; trend analysis; audience-specific views; full loop.
Level 3, Managed
- Practice. 30–50 metrics. Thresholds tied to corrective-action tickets. Trends analysed. Closure rate measured (target ≥85%). Management review consumes the pack. The full 9.1 → 10.1 loop is operational. Internal audit tests the measurement process.
- Tools. BI dashboard or mid-segment GRC SaaS with corrective-action workflow.
- Cost (annual). ₹30–55 lakh (1 FTE BCM ₹18–28 lakh; tooling ₹8–20 lakh; validation ₹4–7 lakh).
- Audit outcome. Zero to minor nonconformities. The 9.1 programme is a programme strength.
- Path to L4. 12–18 months: real-time telemetry for capability metrics; leading-indicator analysis; predictive threshold setting.
Level 4, Predictive
- Practice. Real-time telemetry for capability metrics. Leading-indicator analysis. Supplier-performance scorecards. Predictive threshold setting (thresholds tuned on historical variance). Integrated with enterprise risk register.
- Tools. Enterprise IRM suite or integrated BCM-specialist SaaS with real-time feeds.
- Cost (annual). ₹70 lakh–1.5 crore (1.5–2 FTE ₹30–55 lakh; tooling ₹40 lakh–90 lakh; integration ₹10–25 lakh amortised).
- Audit outcome. Strength noted. Programme is regulator-confidence-building.
- Path to L5. 18–24 months: integrated BCMS/ERM/operational-risk measurement; predictive analytics; self-healing controls; external benchmarking.
Level 5, Resilience by design
- Practice. BCMS performance measurement is integrated with enterprise risk, operational, and technology performance. Predictive analytics forecast resilience posture under scenarios. Self-healing controls. Real-time board-level reporting. External benchmarking with peer organisations.
- Tools. Enterprise IRM suite with predictive analytics; integrated with the operational-technology and business-technology stacks.
- Cost (annual). ₹1.2–3 crore+ (depending on scale and integration depth).
- Audit outcome. Exemplary programme; the firm is a reference for the certification body.
Maturity advancement principles
- Move one level at a time. Trying to skip L2 to L4 fails because the discipline is not yet there.
- The closure rate is the leading indicator of maturity. If the closure rate is <85%, you are not L3, regardless of tooling.
- The MMP is the artefact that survives. Tools change; the MMP (a controlled document) is the institutional memory.
- Sponsorship drives advancement. L3 to L4 requires real investment (tooling, integration, FTE); the sponsor's commitment is the constraint.
Emerging Trends
Real-time BCMS performance telemetry
The historical cadence of BCM measurement (quarterly dashboards, annual evaluations) is being overtaken by the availability of real-time telemetry. Replication health, backup success, DR site readiness, system availability, SOC alert volume, all are available in real time from the IT monitoring stack. The next-generation 9.1 programme integrates these feeds into the BCMS dashboard so that capability metrics are live and threshold breaches are detected in minutes, not quarters. Indian BFSI and large manufacturing are leading this shift; adoption by growing companies is following as GRC SaaS tools mature.
Predictive analytics for resilience posture
Leading-indicator analysis (replication-lag trend predicts RTO breach; supplier-financial-health score predicts supplier-BC failure; plan-currency decay predicts plan failure in the next exercise) is becoming feasible as data accumulates. The L4 organisation uses predictive analytics to forecast resilience posture under scenarios; the L5 organisation uses them to trigger preventive action before the metric breaches. The discipline required, clean data, defined formulas, multi-year trend, is exactly the discipline 9.1 builds.
Operational resilience as the successor frame
The "operational resilience" frame (HKMA OR-2, UK FCA/PRA/CB policy, APRA CPS 230, DORA) is shifting the measurement question from "did we recover within RTO?" to "did we maintain the critical operation within impact tolerance, end-to-end, including third parties?" The end-to-end frame forces measurement of the entire critical-operation chain (people + process + technology + supplier + facility), not just the IT recovery. ISO 22301:2019 Clause 9.1 supports this shift; the MMP should include end-to-end tolerance metrics, not just RTO/RPO.
Climate-driven continuity measurement
ISO 22301:2019 Amendment 1:2024 (climate) added climate-change considerations to Clauses 4.1 and 4.2. The downstream effect on 9.1: the measurement programme must include climate-related continuity parameters (extreme-weather event frequency at each site, flood-risk trend, heat-stress impact on outdoor and facility operations, water-stress impact on cooling-dependent sites). For Indian organisations with sites in climate-vulnerable geographies (coastal Tamil Nadu and Andhra Pradesh, flood-prone Mumbai and Assam, heat-prone northern plains), climate-driven continuity measurement is moving from optional to expected.
AI / generative AI in BCMS measurement
AI/GenAI is appearing in two places in the 9.1 programme: (a) as a data source, AI-driven log analysis that surfaces anomalies the SOC may have missed, AI-driven supplier-news scanning that flags supplier-financial-health deterioration; and (b) as an analytical aid, AI-driven trend analysis, AI-driven threshold tuning, AI-driven narrative generation for the evaluation memo. The technology is immature; the data-quality and validation discipline 9.1 builds is the prerequisite for trustworthy AI use.
DPDP-driven availability and breach measurement
The DPDP Act 2023 made availability of personal data a statutory duty (§8(5)) and breach notification a timed duty (§8(6) + Schedule; DPDP Rules 2025 prescribe 72-hour breach-to-Board notification). The downstream effect on 9.1: every Data Fiduciary must now measure personal-data availability (uptime of personal-data systems, recovery capability) and time-to-notify (Board, affected principals). Significant Data Fiduciaries face enhanced measurement (DPIA cadence, Data Audit). This is the most significant new measurement obligation for Indian organisations since CERT-In 2022.
Integrated GRC measurement
The historical separation of BCMS, ISMS, risk management, compliance, and audit measurement is dissolving as enterprise IRM suites mature. The integrated organisation measures resilience once, with each framework (ISO 22301, ISO 27001, SOC 2, DORA, RBI, SEBI, IRDAI, DPDP) consuming a subset of the same measurement base. The integrated approach reduces double-entry, improves consistency, and lowers total cost. The L4/L5 maturity levels assume integration.
Supplier-ecosystem measurement
The single hardest measurement problem in BCM is supplier-BC capability, the firm's tier-1 suppliers are themselves organisations with their own (often unmeasured) BC programmes. The trend is toward shared measurement platforms (industry consortia, regulator-sponsored data-sharing) that reduce the cost of supplier-BC assessment. Indian BFSI (RBI Outsourcing Master Direction) and capital markets (SEBI CSCRF third-party provisions) are pushing this trend.
Cyber-physical convergence
OT (operational technology) and IT convergence, visible in Indian manufacturing, energy, and critical infrastructure, is forcing BCM measurement across the IT/OT boundary. A DR site that handles IT workloads but not OT workloads is half a DR site; an exercise that tests IT recovery but not OT recovery is half an exercise. The 9.1 programme must measure OT continuity explicitly for organisations with operational technology.
Board reporting standards
Board-level reporting of operational resilience and continuity performance is becoming standardised, driven by SEBI LODR Reg. 21 (Risk Management Committee), RBI board-risk-oversight expectations, and the global operational-resilience movement. The board view of BCMS performance is converging on: RAG status per critical operation, trend lines, regulatory-posture summary, top risks, top actions. The 9.1 programme must produce this view; the BCM must be able to present it verbally.
References and Further Reading
The standard and its companions
- ISO 22301:2019 Security and resilience, Business continuity management systems, Requirements (and Amendment 1:2024 on climate change adaptation).
- ISO 22313:2020 Security and resilience, Business continuity management systems, Guidance on the use of ISO 22301.
- ISO 22300:2021 Security and resilience, Vocabulary (note: the 2018 edition is withdrawn).
- ISO/TS 22317:2021 Security and resilience, Business continuity management systems, Guidelines for business impact analysis (note: the 2015 edition is withdrawn).
- ISO/TS 22318:2021 Security and resilience, Business continuity management systems, Guidelines for supply chain continuity (note: the 2015 edition is withdrawn).
- ISO/TS 22330 Security and resilience, Business continuity management systems, Guidelines for people preparedness.
- ISO/TS 22331 Security and resilience, Business continuity management systems, Guidelines for business continuity strategy.
- ISO/IEC 27001:2022 Information security management systems, Requirements (Clause 9.1 in particular).
Practitioner bodies of knowledge (citable, not quoted)
- BCI practitioner guidance (Edition 7.0, launched 31 October 2023).
- DRI professional-practice framework (living framework).
- BCI Horizon Scan 2025 ("Complex and Interconnected Risk") and Horizon Scan 2024, citable BCM industry datasets.
Indian regulatory instruments (primary sources)
- RBI Master Direction on IT Governance, Risk, Controls and Assurance Practices (7 November 2023, effective 1 April 2024), rbi.org.in.
- RBI Cyber Security Framework in Banks (2 June 2016), rbi.org.in.
- RBI Master Direction on Outsourcing of Information Technology Services (10 April 2023), rbi.org.in.
- SEBI Cybersecurity and Cyber Resilience Framework (CSCRF), CIR/2024/113 (20 August 2024), sebi.gov.in.
- SEBI BCP/DR for Market Infrastructure Institutions, CIR/2021/33 (22 March 2021), sebi.gov.in.
- IRDAI Information and Cyber Security Guidelines 2023 (24 April 2023), irdai.gov.in.
- CERT-In Directions 20(3)/2022-CERT-In (28 April 2022), cert-in.org.in.
- Digital Personal Data Protection Act 2023 (Act 22 of 2023) and DPDP Rules 2025, meity.gov.in.
- Disaster Management Act 2005 (Act 53 of 2005); NDMA Guidelines, ndma.gov.in.
- Companies Act 2013 §134(3)(n), §177; SEBI LODR Regulation 21, mca.gov.in, sebi.gov.in.
- Information Technology Act 2000 (as amended), indiacode.gov.in.
Global frameworks (citable)
- NIST SP 800-34 Rev 1 (May 2010); NIST SP 800-160 Vol 1 + Vol 2 Rev 1 (2016 / 2021); NIST CSF 2.0 (26 February 2024).
- FFIEC IT Examination Handbook, Business Continuity Management Booklet (November 2019).
- DORA, Regulation (EU) 2022/2554 (applies 17 January 2025).
- APRA CPS 230 Operational Risk Management (effective 1 July 2025), particularly paragraph 38 (tolerance triple), paragraph 42 (24-hour critical-operation-disruption notification), paragraph 43 (annual exercise), paragraph 46 (internal audit review).
- FEMA FCD-1 / FCD-2 (2017).
- HKMA Supervisory Policy Manual TM-G-2 / OR-2 / SA-2.
- MAS TRM Guidelines (revised 18 January 2021).
Practitioner certifications (citable as recognised credentials)
- BCI certifications (CBCI, AMBCI, MBCI, FBCI).
- DRI certifications (ABCP, CBCP, MBCP, FBCP).
- NCEMA, ICOR, and equivalent national-body certifications.
Incident anchors (citable as factual events)
- AIIMS Delhi ransomware 2022 (peer-reviewed illustrative scenario in the International Journal of Information Management).
- HDFC Bank RBI action 2 December 2020 (RBI order under Banking Regulation Act).
- Yes Bank moratorium 2020 (Yale Journal of Financial Compliance case).
- Cognizant Maze ransomware April 2020 (SEC 10-Q / 10-K disclosures; $50–70 million recovery cost estimate).
- Chennai floods 2015 (Cognizant official statement).
- Jio 17 September 2024 outage (Reuters; Cloudflare 53% traffic drop).
- Go First 2023 (NCLT; ₹597 crore refund liability).
- SpiceJet 2022 (DGCA 50% capacity cap).
- Air India / SITA 2021 (Reuters; 4.5 million records).
- LG Polymers Vizag 7 May 2020 (NGT ₹50 crore interim penalty).
- CrowdStrike 2024 global IT outage.
- Maersk / Merck NotPetya 2017.
- Colonial Pipeline 2021.
- Change Healthcare 2024.
- Tokyo Stock Exchange 2020 outage.
- DBS Singapore outages (MAS supervisory action).
- Knight Capital 2012 trading failure.
A note on sources and accuracy
Every regulatory reference in this guide has been cross-checked during the July 2026 research pass against the issuing body's official publication where the portal permitted. Items marked in the underlying research as [UNVERIFIED] have been omitted from this guide rather than risk inaccuracy. The withdrawn-edition corrections (ISO 22300:2018 → 2021; ISO/TS 22317:2015 → ISO/TS 22317:2021; ISO/TS 22318:2015 → ISO/TS 22318:2021) have been applied throughout. The contested attribution (Mumbai 12 October 2020 blackout cyber link, Maharashtra "cyber sabotage" vs Union Power Ministry "human error") is presented neutrally where relevant and is not asserted as fact in this guide. DORA's application date (17 January 2025) is cited as the authoritative date; the "June 2025" date sometimes seen in secondary sources is APRA CPS 230's 1 July 2025 commencement, not a DORA date. Where the underlying research flagged an item as unverifiable (e.g., "Airtel Oct 2019 nationwide outage", "Jio 2020 outage", SolarWinds Indian-victim claims), it has not been used in this guide.
This guide is a Singahi product. It paraphrases ISO 22301:2019 Clause 9.1 and never reproduces the standard's text. It is written for growing companies implementing ISO 22301 in the Indian regulatory context. It is not a legal opinion; regulations evolve, and every regulatory citation should be re-confirmed against the canonical .gov.in source before being relied upon in a specific decision.