
On this page
- Quick Reference: A.8.16 in 60 Seconds
- What the Control Asks For
- The Monitoring Scope
- The Monitoring Architecture
- Log Sources & Collection
- Log Management & Centralization
- SIEM Deep Dive
- Security Monitoring Use Cases
- Detection Engineering
- UEBA & Behavioral Analytics
- Cloud Monitoring
- Kubernetes & Container Monitoring
- Database Monitoring
- Network Monitoring
- Endpoint Monitoring
- Alert Management
- The SOC Operating Model
- Metrics & KPIs
- Tool Comparison
- Implementation Roadmap: 8 Weeks
- Common Audit Failures & Fixes
- Illustrative Scenarios: Breaches That Monitoring Could Have Prevented
- Multi-Framework Mapping
- FAQ
Quick Reference: A.8.16 in 60 Seconds
| Question | Answer |
|---|---|
| What is it? | A control requiring organizations to monitor networks, systems, and applications for anomalous behavior and security events. |
| Why does it matter? | You cannot defend what you cannot see. 60% of breaches are discovered by third parties, not the victim. |
| Minimum requirement | Event logging enabled on all critical systems + centralized log collection + review procedure + anomaly detection. |
| Audit red flag | No SIEM, logs only on local systems, no one reviewing logs, no alerting on critical events, no retention policy. |
| Quick win | Enable centralized logging today. Forward Windows Event Logs to a collector. Forward Linux syslog to a central server. |
| Time to implement | 8–12 weeks for full monitoring capability. 2 weeks for basic log centralization. |
| Related controls | A.8.15 (Logging), A.8.17 (Clock Synchronization), A.5.7 (Threat Intelligence), A.5.24 (Incident Response), A.8.1 (Endpoints), A.8.5 (Authentication) |
| ISO 27002 attributes | Control type: Detective, Corrective · Properties: Confidentiality, Integrity, Availability · Concepts: Detect, Respond · Capabilities: Information security event management · Domains: Defence |
The 30-Second Architecture
┌─────────────────────────────────────────────────────────────┐
│  LAYER 4: RESPONSE (SOAR, Incident Response, Automation)    │
│  "Act on what you detect"                                   │
├─────────────────────────────────────────────────────────────┤
│  LAYER 3: ANALYSIS (SIEM, UEBA, Detection Engineering)      │
│  "Correlate, detect, and investigate"                       │
├─────────────────────────────────────────────────────────────┤
│  LAYER 2: AGGREGATION (Log Collection, Parsing, Normalization)│
│  "Collect everything in one place"                          │
├─────────────────────────────────────────────────────────────┤
│  LAYER 1: SOURCES (Endpoints, Network, Cloud, Apps, DBs)  │
│  "Generate logs from every asset"                           │
└─────────────────────────────────────────────────────────────┘
What the Control Asks For
ISO 27001:2022 A.8.16 Text
ISO 27001:2022 Annex A 8.16 asks organizations to monitor networks, systems, and applications for anomalous behavior and act on potential security incidents.
Do you need this control?
A.8.16 is not mandatory in itself: under clause 6.1.3 you include it if your risk assessment calls for it, and record the decision in your Statement of Applicability. Include it wherever anomalous behaviour on networks and systems must be detected, which is most organisations. Small organisations often use managed detection services rather than an in-house SOC.
ISO 27002:2022 Implementation Guidance (Section 8.16)
ISO 27002 8.16 (paraphrased): set the monitoring scope and level from business and security requirements and the law, and keep monitoring records for defined periods. Consider including:
- (a) inbound and outbound network, system and application traffic
- (b) access to systems, servers, network equipment, the monitoring system itself and critical applications
- (c) critical and administrator-level configuration files
- (d) logs from security tools (anti-virus, IDS/IPS, web filters, firewalls, DLP)
- (e) system and network event logs
- (f) checks that code running is authorised and has not been tampered with
- (g) resource use and performance (CPU, disk, memory, bandwidth)
Establish a baseline of normal behaviour (use at normal and peak times; usual time, location and frequency of access per user or group) and look for anomalies such as: unplanned termination of processes; malware-like activity or traffic to known malicious addresses (for example botnet command and control); known attack patterns (denial of service, buffer overflows); unusual system behaviour (keystroke logging, process injection, protocol misuse); bottlenecks and overloads; unauthorised access or attempts; unauthorised scanning; access attempts to protected resources such as DNS, portals and file systems; and unusual user or system behaviour.
Use continuous monitoring tools that handle large volumes, adapt to new threats and alert in real time. Tune alerts to the baseline to cut false positives. Have dedicated, trained people to respond, and redundant ways to receive alerts. Share abnormal events with those running audits, security evaluations and vulnerability scanning (5.25); respond promptly (5.26); and handle false positives by tuning. Threat intelligence (5.7), machine learning, blocklists, technical vulnerability assessments and behavioural monitoring can strengthen monitoring.
What Changed from ISO 27001:2013
| 2013 Version | 2022 Version | Implication |
|---|---|---|
| (none) | A.8.16 Monitoring activities is new in 2022 | One of the 11 new controls; it has no 2013 predecessor |
| A.12.4.1 Event logging; A.12.4.2 Protection of log information; A.12.4.3 Administrator and operator logs | A.8.15 Logging | Logging remains a separate control |
| A.12.4.4 Clock synchronisation | A.8.17 Clock synchronization | Separate, but essential for correlating events |
| A.12.6.1 Management of technical vulnerabilities | A.8.8 | Vulnerability management is separate |
Key implication: A.8.15 makes sure the right events are recorded and protected; A.8.16 adds active monitoring against a baseline and acting on anomalies.
What Auditors Actually Check
| Auditor Action | What They Want to See |
|---|---|
| Monitoring policy | Documented policy covering scope, tools, review frequency, and retention |
| SIEM/dashboard | Live demonstration of centralized monitoring capability |
| Log source coverage | Evidence that all critical systems forward logs to a central location |
| Alert configuration | Show configured alerts for critical events (failed logins, privilege escalation, etc.) |
| Review records | Documented evidence that logs are reviewed regularly (daily/weekly) |
| Incident linkage | Evidence that anomalies are escalated to incident response |
| Clock sync | All logs show consistent, synchronized timestamps (NTP configured) |
| Retention compliance | Logs retained per policy and regulatory requirements |
| Tamper protection | Logs cannot be modified or deleted by administrators |
| Detection coverage | Mapping of detection rules to threats and risks in the risk register |
The Monitoring Policy Minimum Requirements
Every auditor will ask for your monitoring policy. It must contain:
| Section | Minimum Content |
|---|---|
| Purpose | Why monitoring exists, scope of information assets covered |
| Scope | Networks, systems, applications, cloud services, endpoints, databases, physical access |
| Roles | Who operates the SIEM, who reviews alerts, who responds to incidents |
| Log sources | Specific systems and event types that must be logged |
| Collection | How logs are collected, forwarded, and centralized |
| Retention | Retention periods by log type (typically 90 days hot, 1 year warm, 3-7 years cold) |
| Review | Frequency of review (real-time alerts, daily summary, weekly deep-dive, monthly trend) |
| Anomaly response | Procedure for evaluating and escalating anomalies |
| Privacy | Privacy considerations for monitoring user activity, especially in EU/GDPR contexts |
| Metrics | KPIs and performance indicators for the monitoring program |
💡 Practitioner tip: Many 8.16 nonconformities stem from a missing or inadequate monitoring policy. Organizations deploy Splunk or Sentinel but never document the process around it. The tool is not the control. The documented, repeatable process is the control.
The Monitoring Scope
Most guides stop at "networks, systems, and applications." That's incomplete. Here is the complete monitoring scope for a modern organization.
The 12 Monitoring Domains
| Domain | What to Monitor | Critical Events | Typical Tools |
|---|---|---|---|
| 1. Networks | Traffic patterns, flows, connections, bandwidth, protocols | Unusual outbound connections, C2 beaconing, lateral movement | NetFlow collectors, IDS/IPS, NDR (Darktrace, Vectra) |
| 2. Systems (Servers) | OS events, process execution, file changes, logins | Privileged access, unauthorized software, config changes | OS native logging, OSQuery, Wazuh, Sysmon |
| 3. Applications | Login attempts, access patterns, API calls, errors | Failed authentication, injection attempts, abuse patterns | Application logs, APM tools (Datadog, New Relic), RASP |
| 4. Databases | Query patterns, access logs, schema changes, connections | Unusual queries, large exports, privilege escalation | DAM (Imperva, Guardium), native audit logs, pgAudit |
| 5. User Activity | Logins, file access, data downloads, email, web | Off-hours access, bulk downloads, suspicious email rules | UEBA (Exabeam, Splunk UBA), DLP, CASB |
| 6. Endpoints | Process execution, file changes, registry, network | Malware execution, credential dumping, USB insertion | EDR (CrowdStrike, SentinelOne, Defender) |
| 7. Cloud Infrastructure | API calls, resource changes, access patterns, configurations | Unauthorized IAM changes, public bucket creation, unusual API volume | CloudTrail, GuardDuty, Azure Monitor, GCP SCC |
| 8. APIs | Request volume, authentication, error rates, payloads | Abuse, injection, credential stuffing, excessive data exposure | API gateways (Kong, Apigee), WAF logs, native API logs |
| 9. Physical Access | Badge swipes, door alarms, CCTV, visitor logs | Tailgating, unauthorized area access, off-hours entry | Access control systems, physical security logs |
| 10. Third-Party / Supply Chain | Vendor access logs, API integrations, data transfers | Unauthorized vendor access, excessive data pull, integration abuse | Vendor portals, CASB, contractually mandated logs |
| 11. Containers / Kubernetes | Pod events, network policies, runtime behavior, admission | Privilege escalation, suspicious pod creation, network policy violations | Falco, K8s audit logs, container runtime security |
| 12. OT / ICS | PLC events, SCADA logs, network segmentation, HMI | Unauthorized engineering workstation access, protocol anomalies | OT-specific SIEMs, Nozomi Networks, Claroty |
The Cloud-Native Expansion
Modern infrastructure has expanded the monitoring scope dramatically:
| Traditional | Cloud-Native Addition | Why It Matters |
|---|---|---|
| Server logs | Container logs, pod events, K8s audit logs | Ephemeral infrastructure means logs must be captured in real-time |
| Network logs | VPC Flow Logs, CloudWatch, Azure NSG logs | Cloud network traffic is invisible to traditional on-prem taps |
| Firewall logs | Cloud-native firewalls (AWS NFW, Azure FW), WAF logs | Application-layer attacks require Layer 7 visibility |
| Database logs | Cloud DB audit logs (RDS, Cosmos DB, BigQuery) | Managed services have their own logging APIs |
| API logs | API Gateway logs, Lambda execution logs, service mesh telemetry | Serverless functions generate logs you must explicitly configure |
| Physical access | Cloud admin console access, IAM console login | "Physical" access in cloud means console access |
Edge Monitoring
Edge devices, IoT, retail POS, manufacturing sensors, remote offices, are often blind spots.
| Edge Scenario | Monitoring Challenge | Solution |
|---|---|---|
| Remote office with limited bandwidth | Cannot forward all logs to central SIEM | Lightweight forwarders (Fluent Bit), edge aggregation, store-and-forward |
| IoT / OT networks | Protocols are proprietary, devices are fragile | Protocol gateways (Nozomi, Claroty), passive network monitoring |
| Mobile workforce | Devices are off-network, inconsistent connectivity | Cloud-native EDR with offline caching, cloud SIEM ingestion |
| Air-gapped environments | No internet, no cloud SIEM | On-prem SIEM (Elastic, Splunk on-prem), data diode for export |
💡 Practitioner tip: During ISO 27001 Stage 2 audits, auditors often probe for cloud and container monitoring. If you run workloads in AWS or Azure but your monitoring policy only mentions "servers," expect a non-conformity. The scope must match your actual infrastructure.
The Monitoring Architecture
Design Principles
Defense in Depth for Monitoring
Don't rely on a single layer. Build monitoring depth:
┌─────────────────────────────────────────────────────────────┐
│  TIER 4: STRATEGIC (Threat Intelligence, Risk Dashboards) │
│  "What threats are coming? What's our exposure?"            │
├─────────────────────────────────────────────────────────────┤
│  TIER 3: OPERATIONAL (SOC, SIEM, Alerting, Response)      │
│  "What's happening right now? Should we respond?"           │
├─────────────────────────────────────────────────────────────┤
│  TIER 2: TACTICAL (Log Aggregation, Parsing, Storage)     │
│  "Collect, normalize, and store everything"                 │
├─────────────────────────────────────────────────────────────┤
│  TIER 1: TECHNICAL (Endpoint, Network, Cloud, App Logs)   │
│  "Generate telemetry from every asset"                      │
├─────────────────────────────────────────────────────────────┤
│  TIER 0: FOUNDATIONAL (Time Sync, Log Integrity, Policy)  │
│  "Without accurate time and integrity, monitoring is useless"│
└─────────────────────────────────────────────────────────────┘
Centralized vs. Distributed Monitoring
| Model | Description | Best For | Risk |
|---|---|---|---|
| Centralized | All logs flow to one SIEM. Single pane of glass. | Small to mid-size orgs, single geography | Single point of failure, bandwidth saturation, data sovereignty issues |
| Distributed | Multiple regional SIEMs or log aggregators. | Multi-national orgs, data residency requirements | Complex correlation, tool sprawl, inconsistent detection |
| Federated | Central analytics with regional collectors. | Large enterprises, hybrid cloud | Higher complexity, requires data normalization |
| Hierarchical | Edge → Regional → Central tiers. | OT/ICS environments, satellite offices | Latency, potential data loss at tiers |
Practitioner recommendation: Start centralized. Most organizations under 1,000 employees should have one primary SIEM. Above that, consider federated with regional collectors. Above 10,000 employees or multi-national with data residency requirements, go hierarchical.
Real-Time vs. Batch Processing
| Processing Mode | Latency | Use Case | Tool Examples |
|---|---|---|---|
| Real-time streaming | < 1 second | Critical alerts, intrusion detection, automated response | Kafka + Flink, Splunk RT, Sentinel streaming |
| Near-real-time | 1–5 minutes | Security alerts, SIEM correlation, UEBA | Standard SIEM ingestion, scheduled queries |
| Batch/hourly | 1–24 hours | Compliance reports, trend analysis, threat hunting | Scheduled reports, data warehouse queries |
| Deep archival | Days to weeks | Forensic investigation, long-term trend analysis, audit | Cold storage (S3 Glacier, Azure Archive) |
Critical insight: Not everything needs to be real-time. Alerting should be real-time. Threat hunting can be near-real-time. Compliance reporting can be batch. Misjudging this creates alert fatigue and wastes infrastructure budget.
Agent-Based vs. Agentless Collection
| Approach | How It Works | Pros | Cons | Best For |
|---|---|---|---|---|
| Agent-based | Software installed on endpoint/server | Rich data, local filtering, offline caching, response capability | Deployment overhead, agent conflicts, resource consumption | Endpoints, critical servers, cloud VMs |
| Agentless | Network-based or API-based collection | No deployment, no agent conflicts, lower overhead | Limited data depth, network dependency, no offline capability | Network devices, cloud services, legacy systems |
| Hybrid | Agent-based for endpoints, agentless for network/cloud | Best of both worlds | Complexity, cost, two toolchains | Most modern enterprises |
| Specific Collection Method | Category | Use Case |
|---|---|---|
| Syslog / SNMP trap | Agentless | Network devices, firewalls, printers |
| WMI / WinRM | Agentless | Windows event collection without agent |
| Cloud API (CloudTrail, Azure Monitor) | Agentless | Cloud-native services |
| Database native audit | Agentless | Oracle, SQL Server, PostgreSQL audit |
| EDR agent (CrowdStrike, SentinelOne) | Agent-based | Endpoint telemetry, threat detection, response |
| Filebeat / Fluent Bit | Agent-based | Server log forwarding, container log collection |
| OSQuery | Agent-based | Live endpoint querying, fleet visibility |
| Packet capture (SPAN/TAP) | Agentless | Full network traffic analysis, NDR |
On-Premises vs. Cloud vs. Hybrid Monitoring
| Architecture | SIEM Location | Collection Method | Complexity | Cost Model |
|---|---|---|---|---|
| On-premises | Splunk, QRadar, Elastic on-prem | Syslog, agents, WEF | High (self-managed infrastructure) | CapEx + OpEx (hardware, licenses, staff) |
| Cloud-native | Sentinel, Chronicle, Sumo Logic, Datadog | Cloud APIs, cloud agents | Low (managed infrastructure) | OpEx (per-user or per-ingestion pricing) |
| Hybrid | Cloud SIEM + on-prem collectors | Hybrid agents, syslog forwarding | Medium | Mixed (cloud license + on-prem hardware) |
| Multi-cloud | SIEM in one cloud, collecting from others | Cross-cloud IAM, API permissions, VPN/VPC peering | High | Highest (data egress, multi-cloud networking) |
The Hybrid Reality: Most organizations are hybrid. They have on-prem Active Directory, AWS workloads, Azure SaaS, and GCP BigQuery. Your monitoring architecture must accommodate all three without creating blind spots.
Singahi's recommended hybrid architecture:
┌────────────────────────────────────────────────────────────────────┐
│                        CLOUD SIEM (Sentinel / Splunk Cloud)         │
│  ┌─────────────┐  ┌─────────────┐  ┌─────────────┐  ┌──────────┐ │
│  │ Analytics   │  │ Threat Intel│  │ SOAR        │  │ Reporting│ │
│  └─────────────┘  └─────────────┘  └─────────────┘  └──────────┘ │
└────────────────────────────────────────────────────────────────────┘
                              ▲
                              │ Encrypted TLS / VPN
┌────────────────────────────────────────────────────────────────────┐
│                    LOG AGGREGATION LAYER                            │
│  ┌─────────────┐  ┌─────────────┐  ┌─────────────┐  ┌──────────┐ │
│  │ Syslog NG   │  │ Kafka       │  │ Logstash    │  │ Fluentd  │ │
│  └─────────────┘  └─────────────┘  └─────────────┘  └──────────┘ │
└────────────────────────────────────────────────────────────────────┘
                              ▲
        ┌─────────────────────┼─────────────────────┐
        │                     │                     │
┌───────┴───────┐   ┌─────────┴─────────┐   ┌───────┴───────┐
│   ON-PREM     │   │      AWS           │   │    AZURE      │
│  AD, VMware   │   │  CloudTrail, VPC   │   │  Monitor, AD  │
│  Firewalls    │   │  GuardDuty, EKS    │   │  Sentinel,    │
│  Endpoints    │   │  CloudWatch, ALB   │   │  Defender     │
└───────────────┘   └───────────────────┘   └───────────────┘
💡 Practitioner tip: A common architectural mistake is organizations buying Splunk Cloud and then discovering they cannot forward their on-prem firewall logs without a heavy forwarder or syslog gateway. Plan the data flow before you buy the license.
Log Sources & Collection
Operating System Logs
| OS | Log Location | Critical Events | Collection Method |
|---|---|---|---|
| Windows | Security (Event ID 4624/4625), System, Application, Sysmon, PowerShell | Failed logins, privilege escalation, process creation, PowerShell execution | Windows Event Forwarding (WEF), Winlogbeat, NXLog, Splunk UF |
| Linux | /var/log/auth.log, /var/log/secure, /var/log/audit/audit.log, journald | SSH attempts, sudo usage, file integrity changes, SELinux denials | rsyslog, syslog-ng, auditd, Filebeat, Fluent Bit |
| macOS | Unified Logging System (log), Open Directory | Login events, Gatekeeper blocks, file access | osquery, Splunk UF, syslog |
Windows Event IDs Every Monitor Must Track:
| Event ID | Description | Criticality | Why |
|---|---|---|---|
| 4624 | Successful logon | Medium | Baseline activity; monitor for unusual patterns |
| 4625 | Failed logon | High | Brute force, credential stuffing, account reconnaissance |
| 4648 | Explicit credential use | High | Pass-the-hash, lateral movement, runas abuse |
| 4672 | Special privileges assigned | High | Admin login, privilege escalation |
| 4688 | Process creation | Medium | Malware execution, living-off-the-land binaries |
| 4697 | Service installed | High | Persistence via malicious service |
| 4698 | Scheduled task created | High | Persistence mechanism |
| 4720 | User account created | High | Account creation (insider threat, attacker) |
| 4726 | User account deleted | High | Account deletion (cover-up) |
| 4728 | Member added to security group | High | Privilege escalation, group membership abuse |
| 4732 | Member added to local group | High | Local admin addition |
| 4768 | Kerberos TGT requested | Medium | Kerberos abuse, AS-REP Roasting |
| 4769 | Kerberos service ticket requested | Medium | Golden Ticket, Silver Ticket detection |
| 4771 | Kerberos pre-auth failed | High | Kerberoasting, password guessing |
| 4776 | NTLM authentication | Medium | Pass-the-hash, downgrade attacks |
| 5136 | Directory service object modified | High | AD object modification, DCSync preparation |
| 7045 | Service installed (System) | High | Malware persistence |
Linux Audit Rules Every Organization Should Deploy:
## Monitor user/group modifications
-w /etc/passwd -p wa -k identity_changes
-w /etc/group -p wa -k identity_changes
-w /etc/shadow -p wa -k identity_changes

## Monitor sudoers
-w /etc/sudoers -p wa -k sudoers_changes
-w /etc/sudoers.d -p wa -k sudoers_changes

## Monitor SSH configuration
-w /etc/ssh/sshd_config -p wa -k ssh_config_changes

## Monitor privilege escalation
-a always,exit -F arch=b64 -S setuid -S setgid -k privilege_escalation

## Monitor file integrity critical paths
-w /etc/cron.d -p wa -k cron_changes
-w /etc/cron.daily -p wa -k cron_changes
-w /var/spool/cron -p wa -k cron_changes

## Monitor suspicious command execution
-a always,exit -F arch=b64 -S execve -C uid!=euid -k privilege_escalation
Application Logs
| Application Type | What to Log | Format | Collection |
|---|---|---|---|
| Web servers | HTTP requests, errors, authentication, access denied | Apache Combined Log, Nginx, IIS W3C | Filebeat, Fluent Bit, direct syslog |
| Databases | Connections, queries, errors, privilege changes | Native audit log, query log, general log | Database audit agents, JDBC/ODBC forwarding |
| Custom applications | Authentication, authorization, business events, errors | Structured JSON (preferred) or key-value | Application logging libraries (log4j, winston, zap) → forwarder |
| ERP/CRM | User logins, record access, configuration changes, exports | Proprietary or database-backed | API extraction, database trigger logging |
| Send/receive, authentication, attachment types, forwarding rules | SMTP logs, mailbox audit logs | Exchange Admin Center, Office 365 audit, Google Workspace audit |
Application Logging Best Practices (The 5-Field Rule):
Every application log entry should contain at minimum:
- Timestamp (ISO 8601, UTC, millisecond precision)
- Severity (DEBUG, INFO, WARN, ERROR, CRITICAL)
- Event type (auth.success, auth.failure, data.access, config.change)
- Actor (user ID, service account, IP address, session ID)
- Outcome (success, failure, blocked, allowed, with detail)
Example:
{
  "timestamp": "2026-06-15T05:19:50.173Z",
  "severity": "WARN",
  "event_type": "auth.failure",
  "actor": {
    "user_id": "user@company.com",
    "ip_address": "203.0.113.45",
    "session_id": "sess_abc123"
  },
  "outcome": "failure",
  "detail": {
    "reason": "invalid_password",
    "mfa_required": true,
    "attempt_count": 3
  }
}
Network Logs
| Log Type | What It Captures | Key Value | Collection |
|---|---|---|---|
| Firewall logs | Allowed/blocked connections, NAT, VPN | Perimeter control visibility | Syslog, API (cloud firewalls), CEF |
| DNS logs | Queries, responses, NXDOMAIN, DGA patterns | Malware C2 detection, data exfiltration via DNS tunneling | DNS server logs (BIND, Windows DNS), DNS firewalls (Infoblox), Pi-hole |
| Proxy logs | Web requests, URL filtering, user identity | Web browsing behavior, shadow IT, malicious downloads | Squid, BlueCoat, Zscaler, Netskope |
| VPN logs | Connections, authentication, IP assignment, duration | Remote access abuse, compromised credential use | VPN concentrator logs, RADIUS logs |
| Load balancer logs | HTTP requests, TLS handshake, backend health, source IP | DDoS detection, application abuse, geo-anomalies | ALB/NLB logs (AWS), Application Gateway (Azure), NGINX, HAProxy |
| WAF logs | Blocked requests, rule triggers, IP reputation | Application attack detection (SQLi, XSS, LFI) | AWS WAF, Azure WAF, Cloudflare, Imperva, F5 ASM |
Authentication & Identity Logs
| Source | Critical Events | Detection Value |
|---|---|---|
| Active Directory | Logon/logoff, group changes, password changes, Kerberos events | Account compromise, privilege escalation, lateral movement |
| Azure AD / Entra ID | Sign-in logs, audit logs, risk events, MFA failures | Cloud identity compromise, conditional policy bypass |
| Okta | User sessions, MFA events, app assignments, suspicious activity | SSO compromise, session hijacking |
| AWS IAM | Console login, API calls, IAM policy changes, role assumption | Cloud account compromise, privilege escalation |
| SAML / OIDC providers | Assertion issuance, token validation, logout | Federation abuse, token replay |
| RADIUS / TACACS+ | Network device authentication, authorization, accounting | Network infrastructure compromise |
Database Audit Logs
| Database | Audit Mechanism | Critical Events | Tools |
|---|---|---|---|
| Microsoft SQL Server | SQL Server Audit, Extended Events | Login failures, privilege changes, schema modifications, sensitive table access | SQL Server Audit, Splunk DB Connect |
| PostgreSQL | pgaudit extension, log_statement | DDL changes, DML on sensitive tables, connection attempts | pgaudit, Filebeat |
| MySQL | General query log, audit log plugin | Login failures, privilege changes, slow queries | MySQL Enterprise Audit, Percona Audit |
| Oracle | Unified Audit Policy, Fine-Grained Auditing | Privileged user actions, sensitive data access, DBA activity | Oracle Audit Vault, Imperva |
| MongoDB | Audit log (Enterprise), profiler | Authentication, authorization, CRUD on sensitive collections | MongoDB Atlas logs, Filebeat |
| Elasticsearch | Audit log (Security API) | Index access, cluster changes, privilege changes | Elastic Security |
| Snowflake | Account usage views, access history | Query history, login history, warehouse usage | Snowflake's native views, external ingestion |
| AWS RDS | CloudTrail (API), parameter group audit logs, Enhanced Monitoring | Instance modifications, snapshot access, performance anomalies | CloudTrail, RDS console |
Cloud Audit Logs
| Cloud Service | Log Source | Critical Events | Notes |
|---|---|---|---|
| AWS CloudTrail | Management events, data events, insight events | IAM changes, root account use, bucket policy changes, unauthorized API calls | Enable in all regions. Enable data events for S3 and Lambda. |
| AWS GuardDuty | Threat detection findings | Credential compromise, EC2 malware, data exfiltration, reconnaissance | Native ML-based. Feed findings into SIEM. |
| AWS VPC Flow Logs | IP traffic flow | Unusual connections, data exfiltration, lateral movement | Analyzing at scale requires dedicated tools or Athena. |
| AWS Config | Resource configuration changes | Non-compliant resource changes, drift detection | Compliance-focused, not real-time threat detection. |
| Azure Activity Log | Subscription-level events | Resource creation, RBAC changes, policy changes | Feed into Log Analytics workspace. |
| Azure Sign-in Logs | Authentication events | Risky sign-ins, MFA failures, conditional access blocks | Requires Azure AD P1/P2. |
| Azure Defender for Cloud | Security alerts, recommendations | VM malware, container security, SQL threat detection | Native security monitoring. |
| GCP Cloud Audit Logs | Admin Activity, Data Access, System Event, Policy Denied | IAM changes, resource access, policy violations | Automatically enabled. Feed into BigQuery or SIEM. |
| GCP Security Command Center | Findings, assets, vulnerabilities | Misconfigurations, threats, sensitive data exposure | Premium tier adds threat detection. |
| OCI Audit Logs | Tenancy-level events | IAM changes, resource access, policy changes | Feed into Logging Analytics or external SIEM. |
Kubernetes & Container Logs
| Log Source | What It Captures | Critical Events | Collection |
|---|---|---|---|
| K8s Audit Logs | API server requests | Pod creation, RBAC changes, secret access, exec into pods | Enable --audit-log-path on API server. Fluent Bit/Fluentd collection. |
| K8s Event Logs | Resource events (pod scheduling, failures) | CrashLoopBackOff, ImagePullBackOff, OOMKilled | kubectl get events or collected via event exporter |
| Container Runtime (containerd, CRI-O) | Container lifecycle, image pulls, exec | Privileged container creation, host namespace usage, suspicious image pulls | Container runtime logs (often via journald) |
| Falco | Runtime security events | Syscall anomalies, privileged container escapes, sensitive file access | Falco sidecar or daemonset, output to stdout or gRPC |
| Service Mesh (Istio, Linkerd) | mTLS traffic, request metrics, access policies | Unauthorized service communication, policy violations, anomalous traffic | Istio Envoy access logs, Prometheus metrics |
| Admission Controllers | Policy enforcement (OPA, Kyverno) | Rejected deployments, policy violations, mutated resources | Controller logs, often in K8s audit log |
Physical Access Logs
| System | Data Captured | Security Value | Integration |
|---|---|---|---|
| Badge access systems (HID, Lenel, Genetec) | Badge ID, door, timestamp, access granted/denied | Unauthorized area access, tailgating, off-hours entry | SIEM via syslog or API; correlation with logical access |
| Visitor management (Envoy, Proxyclick) | Visitor name, host, check-in/check-out, photo | Unescorted visitors, overstays, badge handoff | API integration, manual review |
| CCTV / VMS (Genetec, Milestone, Avigilon) | Video streams, motion detection, alarm events | Visual verification of access events, investigation support | Typically not integrated into SIEM; alarm events can be |
| Elevator access | Floor access by badge | Restricted floor access, after-hours movement | Often integrated with badge system |
API Gateway Logs
| Gateway | Log Format | Critical Data | Security Use |
|---|---|---|---|
| Kong | Access logs, error logs, plugin logs | Consumer ID, route, latency, status code, request/response size | API abuse detection, rate limit violations, authentication failures |
| AWS API Gateway | CloudWatch Logs, Kinesis Data Firehose | Request ID, IP, user agent, integration latency, WAF integration | Injection detection, unusual request patterns, DDoS |
| Azure API Management | Application Insights, Event Hub | Request/response bodies (optional), backend response, subscription key | Unauthorized API calls, data exfiltration via API |
| Apigee | Analytics, Edge message logs | Developer app, product, resource, fault codes | API monetization abuse, developer policy violations |
| NGINX / Envoy | Standard access logs + custom variables | Upstream response, TLS version, SNI, rate limit status | Microservices security, service mesh monitoring |
💡 Practitioner tip: The most common log source gap is DNS. Organizations monitor firewalls and endpoints but ignore DNS. Much malware uses DNS for command-and-control; if you're not logging DNS queries, you miss a lot of malicious traffic. Enable DNS logging today, it's often free with your existing DNS infrastructure.
Log Management & Centralization
Syslog, Syslog-NG, and Rsyslog
The syslog protocol (RFC 5424) is the backbone of log collection. Understand the differences:
| Daemon | Pros | Cons | Best For |
|---|---|---|---|
| rsyslog | Default on most Linux distros, high performance, modular | Complex configuration syntax, debugging can be painful | Standard Linux log aggregation, medium scale |
| syslog-ng | Cleaner config, better parsing, log routing, patternDB | Not default on most distros, learning curve | Large-scale Linux environments, complex routing needs |
| nxlog | Cross-platform (Windows + Linux), structured config, powerful | Enterprise edition for advanced features | Windows-heavy environments, unified agent |
| Vector (by Datadog) | High performance, VRL (Vector Remap Language), observability | Newer, smaller community | Cloud-native, high-volume environments |
Sample rsyslog Configuration for Centralized Collection:
## /etc/rsyslog.conf
## Enable TCP reception
module(load="imtcp")
input(type="imtcp" port="514")

## Enable UDP reception (fallback only)
module(load="imudp")
input(type="imudp" port="514")

## Template for structured storage
*.* ?RemoteLogs
& stop

## Forward everything to central SIEM over TLS
*.* @@central-siem.company.com:6514;RSYSLOG_SyslogProtocol23Format
Sample syslog-ng Configuration with Parsing:
## /etc/syslog-ng/syslog-ng.conf
source s_network {
    network(
        transport("tcp")
        port(514)
    );
};

destination d_central {
    syslog("central-siem.company.com"
        transport("tls")
        port(6514)
        tls(
            ca_dir("/etc/syslog-ng/ca.d")
            key_file("/etc/syslog-ng/client.key")
            cert_file("/etc/syslog-ng/client.crt")
        )
    );
};

## Parse and route Apache logs
filter f_apache {
    program("apache");
};

destination d_apache_parsed {
    file("/var/log/apache/structured.log"
    );
};

log {
    source(s_network);
    filter(f_apache);
    destination(d_apache_parsed);
    destination(d_central);
};
Windows Event Forwarding (WEF)
WEF is the native, agentless way to collect Windows events. It uses WinRM and is built into Windows Server.
Architecture:
Domain Controllers / Workstations (Source)
           ↓ (WinRM, HTTPS or HTTP with Kerberos)
    Windows Event Collector (WEC) Server
           ↓ (rsyslog, Splunk UF, or direct to SIEM)
           SIEM
Why WEF matters:
- No agent installation on endpoints (agentless)
- Uses Active Directory for authentication
- Supports both push (source-initiated) and pull (collector-initiated) subscriptions
- Can filter events at the source, reducing bandwidth
WEF Subscription Types:
| Type | Description | Use Case |
|---|---|---|
| Source-initiated | Endpoints forward to collector based on AD group | Large environments, roaming laptops |
| Collector-initiated | Collector pulls from specific servers | Small environments, specific server monitoring |
WEF Limitations:
- Only works for Windows events (not Sysmon, not custom application logs)
- Requires Active Directory
- No native encryption without HTTPS configuration
- Limited parsing capability (events are XML)
Best practice: Use WEF for baseline Windows Security events. Use an agent (Winlogbeat, Splunk UF, CrowdStrike) for rich endpoint telemetry including Sysmon, PowerShell, and custom application logs.
Log Shippers: Fluentd, Fluent Bit, Logstash, Vector
Modern log architecture uses lightweight log shippers at the edge.
| Shipper | Language | Resource Usage | Best For | Notable Features |
|---|---|---|---|---|
| Fluentd | Ruby (JVM) | Medium (40MB+ RAM) | Complex parsing, rich plugin ecosystem | 500+ plugins, tag-based routing |
| Fluent Bit | C | Very low (<1MB RAM) | Containers, edge devices, high-volume | K8s-native, can replace Fluentd in most cases |
| Logstash | Java (JVM) | High (1GB+ RAM) | Heavy transformation, Elastic integration | Powerful filter plugins, Beats input, high overhead |
| Vector | Rust | Low | High-performance, cloud-native | VRL language, observability, multiple sinks |
| Filebeat | Go | Low | File-based log collection, Elastic stack | Lightweight, backpressure handling, modules |
| Promtail | Go | Low | Grafana Loki stack | K8s service discovery, label extraction |
Fluent Bit Configuration Example (Kubernetes + CloudWatch + SIEM):
## fluent-bit-config.yaml
apiVersion: v1
kind: ConfigMap
metadata:
  name: fluent-bit-config
data:
  fluent-bit.conf: |
    [SERVICE]
        Flush         1
        Log_Level     info
        Daemon        off
        Parsers_File  parsers.conf
    [INPUT]
        Name              tail
        Tag               kube.*
        Path              /var/log/containers/*.log
        Parser            docker
        DB                /var/log/flb_kube.db
        Mem_Buf_Limit     50MB
    [FILTER]
        Name                kubernetes
        Match               kube.*
        Kube_URL            https://kubernetes.default.svc:443
        Kube_CA_File        /var/run/secrets/kubernetes.io/serviceaccount/ca.crt
        Kube_Token_File     /var/run/secrets/kubernetes.io/serviceaccount/token
    [OUTPUT]
        Name            cloudwatch_logs
        Match           kube.*
        region          us-east-1
        log_group_name  /eks/application-logs
    [OUTPUT]
        Name            syslog
        Match           kube.*
        Host            siem.company.com
        Port            514
        Mode            tcp
        Syslog_Format   rfc5424
Log Parsing and Normalization
Raw logs are useless without parsing. The goal is to convert unstructured or semi-structured logs into a common schema.
Common Log Schemas:
| Schema | Organization | Use Case | Ecosystem |
|---|---|---|---|
| ECS (Elastic Common Schema) | Elastic | Elastic Stack, open standard | Elastic, many third-party tools |
| CIM (Common Information Model) | Splunk | Splunk Enterprise Security | Splunk-specific |
| ASIM (Advanced Security Information Model) | Microsoft | Microsoft Sentinel | Azure/Sentinel-specific |
| CEF (Common Event Format) | ArcSight | Legacy but widely supported | ArcSight, many firewalls, legacy tools |
| LEEF (Log Event Extended Format) | IBM | QRadar integration | IBM QRadar |
| JSON (custom) | You | Flexibility, human readability | Modern applications, custom parsers |
| OTel (OpenTelemetry) | CNCF | Observability, metrics + logs + traces | Cloud-native, vendor-neutral |
Parsing Example: Apache Combined Log to ECS:
Raw: 192.168.1.1 - - [15/Jun/2026:05:19:50 +0000] "GET /api/users HTTP/1.1" 200 1234 "https://app.company.com" "Mozilla/5.0"

ECS Parsed:
- source.ip: 192.168.1.1
- http.request.method: GET
- url.path: /api/users
- http.response.status_code: 200
- http.response.body.bytes: 1234
- http.request.referrer: https://app.company.com
- user_agent.original: Mozilla/5.0
- event.category: web
- event.dataset: apache.access
Normalization Pipeline:
┌─────────────┐    ┌─────────────┐    ┌─────────────┐    ┌─────────────┐
│  Raw Log    │ →  │   Parse     │ →  │  Enrich     │ →  │  Normalize  │
│  (Apache,   │    │  (Regex,    │    │  (GeoIP,    │    │  (ECS, CIM,│
│  Windows,   │    │  Grok,      │    │  Threat     │    │  ASIM)      │
│  JSON)      │    │  Dissect)   │    │  Intel, AD) │    │             │
└─────────────┘    └─────────────┘    └─────────────┘    └─────────────┘
Log Aggregation Architecture Patterns
Pattern 1: Direct to SIEM (Small Orgs)
Endpoints → Splunk UF / Filebeat → Splunk / Elastic
- Simple, low latency
- No intermediate buffering
- Risk: SIEM outage = data loss
Pattern 2: Message Queue Buffering (Mid-Size)
Endpoints → Fluent Bit → Kafka → Logstash → Elastic
- Kafka provides buffering and replay
- Decouples collection from analysis
- Better for high-volume or bursty environments
Pattern 3: Cloud-Native Pipeline (Cloud-First)
CloudWatch / Azure Monitor / GCP Logging → Data Firehose / Event Hub → S3 / Data Lake → Athena / Spark → SIEM
- efficient for high volume
- Enables long-term storage and batch analytics
- Higher latency for real-time alerting
Pattern 4: Multi-Cloud Federation (Enterprise)
AWS CloudTrail → Kinesis → Lambda (normalize) → Kafka
Azure Activity Logs → Event Hub → Function (normalize) → Kafka
On-Prem syslog → syslog-ng → Kafka
Kafka → Splunk / Sentinel / Elastic (central SIEM)
- Unified schema across all sources
- Complex to build and maintain
- Requires dedicated data engineering team
💡 Practitioner tip: Pattern 2 usually suits organizations with 100–5,000 employees and Pattern 4 suits organizations above 5,000 employees or with multi-cloud requirements. Pattern 1 is acceptable for under 100 employees but will create pain as you scale.
SIEM Deep Dive
Figure · Matrix
How the options compare: Per GB ingested to Freemium / tiered
A SIEM is the brain of your monitoring operation. Choosing the wrong one is a multi-year mistake. This section covers the major platforms in forensic detail.
Splunk Enterprise / Splunk Cloud
| Attribute | Detail |
|---|---|
| Architecture | Proprietary SPL (Search Processing Language), indexed data, schema-on-read |
| Deployment | On-prem (Enterprise), SaaS (Cloud), or hybrid (Cloud with on-prem forwarders) |
| Ingestion | Heavy Forwarders, Universal Forwarders, HTTP Event Collector (HEC), syslog, APIs |
| Strengths | Most powerful search language, largest app ecosystem, mature SOAR (Splunk SOAR), strong community |
| Weaknesses | expensive at scale, SPL learning curve, resource-heavy infrastructure |
| Best for | Large enterprises, complex correlation, organizations with existing Splunk investment |
Splunk Enterprise Security (ES):
- Pre-built correlation searches for common use cases
- Risk scoring framework
- Notable event management
- Threat intelligence framework (STIX/TAXII)
- Incident Review dashboard
- Cost: Additional license on top of Splunk base
Splunk SOAR:
- Playbook automation
- 300+ integrations
- Case management
- Cost: Additional license, but essential for SOC efficiency
Splunk for ISO 27001:
- Pre-built compliance dashboard for ISO 27001
- Data models for Authentication, Change, Endpoint, Network
- Ability to map events to Annex A controls
IBM QRadar
| Attribute | Detail |
|---|---|
| Architecture | Proprietary Ariel database, normalized event format (QRadar DSM) |
| Deployment | On-prem (QRadar SIEM), SaaS (QRadar on Cloud), or QRadar SIEM Virtual |
| Ingestion | Syslog, APIs, QRadar WinCollect, QRadar Log Source Management |
| Pricing | Per Events Per Second (EPS) or Flows Per Minute (FPM). Growing-company friendly. |
| Strengths | Excellent out-of-box rules, strong network behavior analytics, good for regulated industries (finance, government) |
| Weaknesses | Aging UI, slower search for large datasets, smaller app ecosystem than Splunk |
| Best for | Financial services, government, organizations with existing IBM security stack |
QRadar Differentiators:
- QRadar Network Insights: Deep packet inspection without decryption
- QRadar User Behavior Analytics (UBA): Free add-on for user anomaly detection
- QRadar Vulnerability Manager: Integration with vulnerability data for risk-based prioritization
- QRadar Advisor with Watson: AI-assisted threat investigation (limited value in practice)
Microsoft Sentinel
| Attribute | Detail |
|---|---|
| Architecture | Azure-native, built on Log Analytics workspace, KQL (Kusto Query Language) |
| Deployment | Cloud-only (Azure). Collectors for on-prem, multi-cloud, and SaaS. |
| Ingestion | Azure Monitor Agent, Log Analytics API, Azure Event Hub, third-party connectors (50+), CEF/syslog via Log Analytics agent |
| Strengths | Native Azure integration, excellent Microsoft 365/Defender integration, KQL is powerful, SOAR built-in (Logic Apps), efficient for Microsoft-heavy orgs |
| Weaknesses | Less mature for non-Microsoft environments, KQL learning curve, can become expensive at scale without commitment tiers |
| Best for | Microsoft-heavy organizations (Azure, M365, Defender), growing companies, cloud-first companies |
Sentinel Key Features:
- Microsoft 365 Defender Integration: Automatic ingestion of Defender for Endpoint, Identity, Cloud Apps, and Office 365 alerts
- Built-in SOAR: Azure Logic Apps playbooks for automation
- Microsoft Threat Intelligence: Free integration with Microsoft TI feeds
- Hunting Queries: Community-driven KQL queries (GitHub: Azure/Azure-Sentinel)
- Fusion ML: Multi-stage attack detection across signals
- UEBA: Built-in (requires Azure AD P2)
Sentinel Pricing Reality:
- A 500-person company with Microsoft 365 E5 gets significant data ingestion included
Google Chronicle
| Attribute | Detail |
|---|---|
| Architecture | Google-native, hyper-scale backend, YARA-L detection language |
| Deployment | Cloud-only (Google Cloud). Collectors for multi-cloud and on-prem. |
| Ingestion | Chronicle Forwarder, Google Cloud Logging, APIs, CEF/syslog |
| Pricing | Per GB/day or per user/year. Marketed as "unlimited retention" with per-user pricing. |
| Strengths | Unlimited retention (differentiating feature), extremely fast search over years of data, YARA-L for detection, native VirusTotal integration, Mandiant threat intel |
| Weaknesses | Smaller ecosystem, newer product, less third-party integration than Splunk/Sentinel, requires Google Cloud adoption |
| Best for | Security teams prioritizing threat hunting over real-time SOC, organizations with Google Cloud presence, Mandiant customers |
Chronicle Unique Value:
- Unlimited Retention: All data retained at no extra cost. This is a paradigm shift for forensic investigations.
- Asset-Entity Graph: Automatic entity extraction (users, devices, IPs) and relationship mapping
- Curated Detections: Google/Mandiant-authored YARA-L rules
- VirusTotal Enterprise: Included for file/hash investigation
Elastic Security (Elastic Stack)
| Attribute | Detail |
|---|---|
| Architecture | Open-source Elasticsearch + Kibana + Elastic Agent/Beats. Elastic Security is the SIEM UI. |
| Deployment | Self-managed (on-prem/cloud VMs), Elastic Cloud (managed), or Elastic Cloud on Kubernetes |
| Ingestion | Elastic Agent (unified), Filebeat, Winlogbeat, Packetbeat, Auditbeat, Metricbeat, custom integrations |
| Pricing | Self-managed: free (open source) or Elastic license for advanced features. Elastic Cloud: resource-based. |
| Strengths | Best open-source SIEM, extremely fast search, flexible schema (ECS), growing detection rule library, no per-GB pricing for self-managed |
| Weaknesses | Self-managed requires expertise, less polished SOAR than competitors, smaller enterprise support ecosystem |
| Best for | Cost-conscious organizations, tech-savvy teams, open-source advocates, high-volume data environments |
Elastic Security Components:
- Elastic Agent: Unified agent replacing Beats
- Fleet: Centralized agent management
- Detection Engine: Rule-based detection with KQL + EQL (Event Query Language)
- Cases: Built-in case management
- Osquery Manager: Live endpoint querying
- Threat Intelligence: STIX/TAXII integration, custom IOC lists
- ML Jobs: Anomaly detection for rare events, unusual traffic, beaconing
Elastic Pricing (Self-Managed):
- Open source (free): Core SIEM functionality
- Key advantage: You pay for infrastructure, not per GB. High-volume environments can be dramatically cheaper.
LogRhythm
| Attribute | Detail |
|---|---|
| Architecture | Proprietary AI Engine, centralized log management, integrated UEBA |
| Deployment | On-prem (XM/PM) or SaaS (LogRhythm Cloud) |
| Ingestion | Syslog, agents, APIs, Beats, CEF |
| Pricing | Per node or per GB. Growing-company focused. |
| Strengths | Strong integrated UEBA, good case management out-of-box, analyst-friendly UI, fast time-to-value |
| Weaknesses | Smaller ecosystem, less cloud-native, slower innovation pace |
| Best for | Growing companies wanting integrated UEBA without buying separate tools |
Sumo Logic
| Attribute | Detail |
|---|---|
| Architecture | Cloud-native, multi-tenant, proprietary query language |
| Deployment | Cloud-only (SaaS). Collectors for on-prem and cloud. |
| Ingestion | Installed Collectors, Hosted Collectors, APIs, CloudWatch, Azure Monitor, GCP |
| Pricing | Per GB/day ingested. Freemium tier available. |
| Strengths | Pure cloud-native, good for DevOps/SRE teams, strong log analytics, PCI compliance features |
| Weaknesses | Less security-focused than Splunk/Sentinel, smaller SOAR capability, not ideal for pure SOC use |
| Best for | DevOps-heavy organizations, cloud-native companies, hybrid security + observability use case |
Datadog Security Monitoring
| Attribute | Detail |
|---|---|
| Architecture | Cloud-native, unified observability + security platform |
| Deployment | Cloud-only (SaaS). Agents for infrastructure. |
| Ingestion | Datadog Agent, Cloud integrations, APIs, Log Forwarding |
| Pricing | Per host/month (infrastructure) + per GB/day (logs) + per host/month (security). |
| Strengths | Strong observability integration, Cloud Security Posture Management (CSPM) included, Cloud Workload Security (CWS) for runtime threat detection, SIEM is improving rapidly |
| Weaknesses | Security SIEM is newer and less mature than dedicated SIEMs, pricing can escalate quickly with full stack |
| Best for | Organizations already using Datadog for APM/infrastructure monitoring, cloud-native DevOps teams |
Datadog Security Products:
- Security Monitoring: SIEM capability (log analysis, detection rules)
- Cloud SIEM: Full SIEM with dashboards, case management
- Cloud Security Posture Management (CSPM): Misconfiguration detection
- Cloud Workload Security (CWS): Runtime threat detection (Falco-like)
- Application Security Management (ASM): In-app threat detection (RASP-like)
New Relic Security
| Attribute | Detail |
|---|---|
| Architecture | Observability-first, security add-on |
| Deployment | Cloud-only (SaaS) |
| Pricing | Per GB/day + per user |
| Strengths | Strong observability foundation, good for application security |
| Weaknesses | Security SIEM is immature, not a primary SOC platform |
| Best for | Organizations already invested in New Relic wanting to add security context |
Wazuh (Open Source)
| Attribute | Detail |
|---|---|
| Architecture | Open-source SIEM + XDR + CSPM. Fork of OSSEC. |
| Deployment | Self-managed (Linux server + agents). Free. |
| Ingestion | Wazuh agents, syslog, cloud APIs, Docker integration |
| Pricing | Free (open source). Commercial support available. |
| Strengths | Free, includes EDR-like capability (file integrity, rootkit detection, active response), integrates with Elastic/Kibana, good for compliance |
| Weaknesses | Requires significant self-management, smaller detection rule library, limited SOAR, scalability challenges beyond 10,000 agents |
| Best for | Budget-constrained organizations, small SOC teams, compliance-first monitoring |
Wazuh Capabilities:
- Log Analysis: Collects and analyzes logs from endpoints, network devices, applications
- File Integrity Monitoring (FIM): Detects file changes in real-time
- Malware Detection: Rootkit detection, anomaly detection
- Active Response: Automated blocking of IPs, disabling accounts
- Vulnerability Detection: Scans endpoints for CVEs
- CSPM: Cloud security posture for AWS, Azure, GCP
- Container Security: Docker and Kubernetes monitoring
Graylog (Open Source)
| Attribute | Detail |
|---|---|
| Architecture | Open-source log management. Built on MongoDB + Elasticsearch/OpenSearch. |
| Deployment | Self-managed. Enterprise version adds features. |
| Ingestion | Syslog, GELF, Beats, APIs, AWS Kinesis, Kafka |
| Pricing | Open source (free). Enterprise license for alerts, archiving, audit. |
| Strengths | Simple, fast search, good syslog collection, easy to deploy, lightweight |
| Weaknesses | Not a full SIEM (limited correlation, no UEBA, no SOAR), requires self-management |
| Best for | Log aggregation and search, smaller teams, syslog-heavy environments |
SIEM Comparison by Organization Size
| Organization Size | Recommended SIEM | Pricing model | Why |
|---|---|---|---|
| Cloud-native / DevOps | Datadog Security, Chronicle, or Elastic | Varies | Prioritize observability integration and cloud-native architecture. |
SIEM Pricing Models Explained
| Model | Description | When It's Cheaper | When It's expensive |
|---|---|---|---|
| Per GB ingested | Splunk, Sentinel, Datadog logs | Low volume, selective ingestion | High volume, verbose applications |
| Per EPS (Events Per Second) | QRadar | Steady, predictable event rates | Bursty traffic, event storms |
| Per user/host | Datadog, Chronicle, some Sentinel tiers | Fixed infrastructure size | Rapid growth, scaling unpredictably |
| Per node/device | LogRhythm | Small number of high-value assets | Large, distributed endpoint population |
| Infrastructure-based | Self-managed Elastic, Wazuh | High volume, dedicated team | Small volume, limited ops expertise |
| Freemium / tiered | Sumo Logic, Sentinel | Startups, gradual growth | Crossing tier thresholds unexpectedly |
Cost Optimization Strategies:
- Filter before ingest: Drop debug logs, health checks, and duplicate events at the collector
- Use hot/warm/cold tiers: Only keep recent data in expensive hot storage
- Selective parsing: Not every field needs to be indexed
- Sample high-volume logs: Application performance metrics can be sampled 1:100
- Dedicated ingestion windows: Batch non-critical logs during off-peak hours
- Negotiate commit tiers: Sentinel and Splunk offer significant discounts for volume commitments
Security Monitoring Use Cases
This is where most guides stay generic. Here are specific, actionable detection use cases with exact detection logic.
Use Case 1: Account Compromise
Scenario: Attacker obtains credentials via phishing or credential stuffing and logs into a corporate account.
Detection Logic:
| Signal | Detection Rule | Severity |
|---|---|---|
| Impossible travel | Login from two geographically distant locations within impossible time window | High |
| Off-hours login | First login outside business hours (e.g., 10 PM–5 AM) for this user in 90 days | Medium |
| New device / browser | Login from a device or browser never seen for this user | Medium |
| MFA bypass | Successful login after multiple MFA failures | High |
| Password spray | Multiple failed logins across many accounts from single IP | High |
| Suspicious email rule | Inbox rule created to forward all email to external address | Critical |
| Login after breach data | Password found in known breach database (via HIBP or similar) | Medium |
Example Splunk SPL:
| tstats `summariesonly` count from datamodel=Authentication by _time, src_user, src_ip, action
| where action="failure"
| stats count by src_user, src_ip
| where count > 5
| lookup geo_ip src_ip as src_ip
| where distance(src_lat, src_lon, user_home_lat, user_home_lon) > 500 AND time_window < 2h
| eval severity="high"
Use Case 2: Privilege Escalation
Scenario: Attacker or insider elevates privileges to gain unauthorized access.
Detection Logic:
| Signal | Detection Rule | Severity |
|---|---|---|
| Local admin addition | User added to local Administrators group (Event ID 4732) | High |
| Domain admin addition | User added to Domain Admins (Event ID 4728) | Critical |
| sudo abuse | Unusual sudo commands (e.g., sudo su, sudo bash) by non-admin user | High |
| IAM policy change | IAM policy attached to user or role allowing new permissions (CloudTrail) | High |
| Azure AD role change | Privileged role assigned (e.g., Global Administrator) | Critical |
| Kubernetes RBAC change | ClusterRoleBinding or RoleBinding created with elevated privileges | High |
| Pass-the-hash | Event ID 4648 with NTLM and suspicious process (e.g., mimikatz indicators) | Critical |
| Kerberoasting | Service ticket request (Event ID 4769) with weak encryption (RC4) | High |
| DCSync | Directory replication request from non-DC account (Event ID 4662) | Critical |
Example Sigma Rule (Privilege Escalation, Local Admin):
title: User Added to Local Administrators
logsource:
  product: windows
  service: security
detection:
  selection:
    EventID: 4732
    TargetUserName: Administrators
  condition: selection
level: high
Use Case 3: Lateral Movement
Scenario: Attacker moves from compromised endpoint to other systems within the network.
Detection Logic:
| Signal | Detection Rule | Severity |
|---|---|---|
| RDP hop | User RDPs to Server A, then RDPs from Server A to Server B | High |
| PSExec execution | Sysmon Event ID 1 with Image containing "psexec" or "psexesvc" | High |
| WMI execution | Sysmon Event ID 1 with ParentImage containing "wmic" | High |
| PowerShell remoting | WinRM or PowerShell remoting connections from workstations | Medium |
| SSH lateral movement | SSH from server to server (unusual for this source) | Medium |
| Service creation for lateral movement | Service created on remote host (Event ID 4697) from unusual source | High |
| Pass-the-ticket | Kerberos TGS request with abnormal ticket lifetime or encryption | High |
Use Case 4: Data Exfiltration
Scenario: Sensitive data is transferred out of the organization.
Detection Logic:
| Signal | Detection Rule | Severity |
|---|---|---|
| Large outbound transfer | Outbound data volume > 3x baseline for this user/system | High |
| Unusual cloud upload | Bulk upload to personal cloud storage (OneDrive personal, Google Drive, Dropbox) | High |
| Database bulk export | SELECT query returning > 10,000 rows on sensitive table | High |
| Email with large attachment | Email sent to external domain with attachment > 50MB | Medium |
| USB mass storage | USB device with high read/write volume on sensitive file server | High |
| DNS tunneling | High volume of DNS queries to unusual domains, or TXT records with large payloads | High |
| HTTPS to suspicious domain | Large HTTPS transfer to newly registered or DGA domain | High |
| Print to PDF abuse | Mass printing to PDF printer on sensitive document repository | Medium |
Example KQL (Sentinel, Data Exfiltration via Email):
OfficeActivity
| where Operation == "Send" and RecipientScope == "External"
| where Attachments has_any ("pdf", "docx", "xlsx", "csv", "zip")
| extend AttachmentSize = toint(AttachmentsSize)
| where AttachmentSize > 52428800  // 50MB
| summarize TotalSize=sum(AttachmentSize), Count=count() by UserId, bin(TimeGenerated, 1h)
| where Count > 10 or TotalSize > 500000000  // 500MB
| project TimeGenerated, UserId, TotalSize, Count
Use Case 5: Malware and Ransomware
Detection Logic:
| Signal | Detection Rule | Severity |
|---|---|---|
| Known malware hash | File hash matches known malware IOC | Critical |
| Signature detection | EDR/AV detects known malware family | Critical |
| Behavioral indicators | Process injection, LOLBIN execution (e.g., certutil downloading file) | High |
| Ransomware file activity | Mass file extension changes (.encrypted, .locked) in short time window | Critical |
| Shadow copy deletion | vssadmin delete shadows /all /quiet (Sysmon Event ID 1) | Critical |
| Backup service stop | Service stop for backup or AV services | High |
| Ransom note creation | File named "README.txt", "HOW_TO_DECRYPT.html" created en masse | Critical |
| Network beaconing | Regular outbound connections to same IP at fixed intervals | High |
Use Case 6: DDoS Attack
Detection Logic:
| Signal | Detection Rule | Severity |
|---|---|---|
| Volume anomaly | Inbound requests > 10x baseline | High |
| Source diversity | Requests from > 1,000 unique source IPs in 1 minute | Medium |
| Slowloris / Slow POST | Connections with very slow request completion | Medium |
| Application-layer flood | High rate of login attempts or API calls from single source | High |
| Reflected amplification | UDP traffic spike (DNS, NTP, SSDP) from spoofed sources | Critical |
Use Case 7: Insider Threat
Detection Logic:
| Signal | Detection Rule | Severity |
|---|---|---|
| Bulk file access | User accesses > 500 files in a folder they normally don't access | High |
| Resignation indicator | User accesses performance review, HR folder, or prints resume after hours | Medium |
| Data export before departure | High data access in 30 days before resignation | High |
| Privilege abuse | Admin accesses sensitive data they don't need for job function | High |
| Off-hours database access | Database login at 2 AM by non-DBA user | High |
| External communication | Email to personal address with attachments containing customer data | Critical |
| Print volume spike | Print volume > 3x personal baseline in a week | Medium |
Use Case 8: Brute Force and Credential Stuffing
Detection Logic:
| Signal | Detection Rule | Severity |
|---|---|---|
| Multiple failed logins | > 10 failed logins from single IP in 5 minutes | High |
| Distributed brute force | Same username with failed logins from multiple IPs | High |
| Credential stuffing | Same IP with failed logins for multiple usernames | High |
| Successful login after brute force | Successful login after 10+ failures from same IP | Critical |
| Password spray | Single password attempted across many accounts (low-and-slow) | High |
| MFA fatigue attack | Multiple MFA push notifications to same user in short window | High |
Use Case 9: API Abuse
Detection Logic:
| Signal | Detection Rule | Severity |
|---|---|---|
| Rate limit violations | API client exceeding rate limits repeatedly | Medium |
| Authentication abuse | Multiple API key failures from single client | High |
| Data scraping | Sequential ID enumeration (e.g., /api/users/1, /api/users/2...) | High |
| Unusual endpoint access | API endpoint accessed that this client has never used | Medium |
| Large payload requests | POST/PUT requests with unusually large body sizes | Medium |
| Off-hours API volume | API traffic > 5x baseline outside business hours | High |
| Error rate spike | 4xx/5xx error rate > 20% for an API endpoint | Medium |
Use Case 10: Cloud Misconfiguration Exploitation
Detection Logic:
| Signal | Detection Rule | Severity |
|---|---|---|
| Public bucket created | S3 bucket ACL or policy changed to public (CloudTrail) | Critical |
| Security group wide open | Inbound 0.0.0.0/0 added to security group (CloudTrail) | Critical |
| IAM key creation | New IAM access key created for root or admin user | High |
| Database public access | RDS instance modified to allow public access | Critical |
| Privilege escalation via IAM | iam:AttachUserPolicy with AdministratorAccess policy | Critical |
| CloudTrail disabled | CloudTrail stopLogging or deleteTrail event | Critical |
| KMS key deletion | kms:ScheduleKeyDeletion event | High |
| Unusual region usage | API calls in region where organization has no presence | Medium |
Detection Engineering
Detection engineering is the discipline of building, testing, and maintaining detection logic. It is the core technical function of a modern security monitoring program.
The Detection Engineering Lifecycle
┌──────────────┐    ┌──────────────┐    ┌──────────────┐    ┌──────────────┐    ┌──────────────┐
│  RESEARCH    │ →  │  DEVELOP     │ →  │  TEST        │ →  │  DEPLOY      │ →  │  MAINTAIN    │
│  (Threat     │    │  (Write rule,│    │  (Unit test, │    │  (CI/CD,     │    │  (Tune, update│
│  intel,      │    │  query,      │    │  integration │    │  version     │    │  for new     │
│  incident    │    │  playbook)   │    │  test,       │    │  control,    │    │  variants,   │
│  post-mortem)│    │              │    │  red team)   │    │  rollback)   │    │  deprecate)  │
└──────────────┘    └──────────────┘    └──────────────┘    └──────────────┘    └──────────────┘
Rule Writing Frameworks
Sigma
Sigma is the generic signature format for SIEM rules. It allows you to write one rule and convert it to Splunk SPL, KQL, Elastic DSL, QRadar AQL, and others.
Why Sigma matters:
- Vendor-agnostic rule format
- Large community repository (github.com/SigmaHQ/sigma)
- Enables rule portability between SIEMs
- Supports CI/CD for detection engineering
Example Sigma Rule (Suspicious PowerShell Download):
title: Suspicious PowerShell Download
logsource:
  product: windows
  service: sysmon
detection:
  selection:
    EventID: 1
    Image|endswith: '\powershell.exe'
    CommandLine|contains:
      - 'IEX(New-Object Net.WebClient)'
      - 'Invoke-Expression'
      - 'bitsadmin'
      - 'certutil -urlcache'
  condition: selection
falsepositives:
  - Legitimate administrative scripts
level: high
Sigma Rule Conversion:
## Convert to Splunk SPL
sigmac -t splunk rule.yml

## Convert to Microsoft Sentinel KQL
sigmac -t azure Sentinel rule.yml

## Convert to Elastic DSL
sigmac -t es-qs rule.yml

## Convert to QRadar AQL
sigmac -t qradar rule.yml
YARA
YARA is the pattern matching tool for malware identification and classification. While primarily for files, YARA-L is used in Chronicle for log-based detection.
YARA for File Detection:
rule APT_MALWARE_Example {
    meta:
        description = "Detects known APT malware family"
        author = "Security Team"
        date = "2026-06-15"
    strings:
    condition:
}
YARA-L for Log Detection (Chronicle):
rule suspicious_dns_tunneling {
  meta:
    author = "Security Team"
    description = "Detects potential DNS tunneling"
  events:


    condition:
}
Snort / Suricata Rules (Network Detection)
For organizations running IDS/IPS or network detection:
alert tcp any any -> any 443 (msg:"SUSPICIOUS TLS SNI - DGA Pattern";
    tls.sni; pcre:"/[a-z]{20,30}\.(com|net|org)/";
    sid:1000001; rev:1;)
Detection-as-Code
Detection-as-Code is the practice of managing detection rules with the same rigor as application code.
Principles:
- Version control: All rules in Git
- Peer review: Pull requests for rule changes
- Automated testing: Unit tests for every rule
- CI/CD deployment: Rules deployed via pipeline, not manual UI configuration
- Documentation: Every rule has a README explaining logic, false positives, and response
- Metrics: Track rule performance, false positive rate, and detection latency
Sample Detection-as-Code Repository Structure:
detections/
├── windows/
│   ├── privilege_escalation/
│   │   ├── local_admin_addition.yml
│   │   ├── local_admin_addition_test.py
│   │   └── README.md
│   ├── lateral_movement/
│   │   ├── psexec_execution.yml
│   │   └── wmi_lateral_movement.yml
│   └── malware/
│       ├── ransomware_behavior.yml
│       └── cobalt_strike_beacon.yml
├── linux/
│   ├── privilege_escalation/
│   ├── persistence/
│   └── lateral_movement/
├── cloud/
│   ├── aws/
│   ├── azure/
│   └── gcp/
├── network/
│   ├── dns_tunneling.yml
│   └── c2_beaconing.yml
└── tests/
    ├── data/
    │   ├── windows_security.log
    │   ├── cloudtrail.json
    │   └── sysmon.json
    └── test_runner.py
CI/CD Pipeline for Detection Rules:
## .github/workflows/detection-deploy.yml
name: Detection Deployment
on:
  push:
    branches: [main]
  pull_request:
    branches: [main]

jobs:
  test:
    runs-on: ubuntu-latest
    steps:
      - uses: actions/checkout@v4
      - name: Install Sigma CLI
        run: pip install sigmatools
      - name: Validate Sigma Rules
        run: sigma check detections/
      - name: Convert and Test Rules
        run: |
          python tests/test_runner.py --target-splunk
          python tests/test_runner.py --target-sentinel

  deploy-splunk:
    needs: test
    if: github.ref == 'refs/heads/main'
    runs-on: ubuntu-latest
    steps:
      - uses: actions/checkout@v4
      - name: Deploy to Splunk
        run: |
          python scripts/deploy_splunk.py --env production
        env:

  deploy-sentinel:
    needs: test
    if: github.ref == 'refs/heads/main'
    runs-on: ubuntu-latest
    steps:
      - uses: actions/checkout@v4
      - name: Deploy to Sentinel
        run: |
          python scripts/deploy_sentinel.py --env production
        env:
Testing Detections
Every detection rule must be tested before deployment. Testing methods:
| Test Type | How | Purpose | Frequency |
|---|---|---|---|
| Unit test | Feed known log samples to rule | Validate rule logic | Every rule change |
| Integration test | Test in staging SIEM with real data | Validate in environment | Weekly |
| Red team test | Simulate attack, verify detection fires | Validate end-to-end | Quarterly |
| Purple team test | Collaborate with red team, validate and tune | Tune and improve | Monthly |
| False positive review | Review alert output for benign triggers | Maintain quality | Weekly |
Red Team Test Example (Account Compromise):
## Step 1: Create test account
create_test_user "detection_test_user"

## Step 2: Simulate impossible travel
login_from "detection_test_user" "New York"    # 9:00 AM EST
login_from "detection_test_user" "Tokyo"     # 9:30 AM EST (impossible)

## Step 3: Verify detection fires within 15 minutes
assert_detection_fired "impossible_travel" "detection_test_user" within 15m

## Step 4: Cleanup
delete_test_user "detection_test_user"
False Positive Tuning
False positives destroy SOC credibility. The tuning process:
- Measure baseline: Run rule in "monitoring mode" for 2 weeks. Count alerts per day.
- Categorize: Tag each alert as true positive, false positive, or benign true positive.
- Identify patterns: Are false positives from specific systems, users, or time windows?
- Add exclusions: Add
filterconditions to exclude known benign patterns. - Re-test: Run for another 2 weeks. Target < 5% false positive rate.
- Document: Maintain exclusion documentation with business justification and expiry date.
Example Tuning Evolution:
## Version 1: Initial rule (too broad)
title: Off-Hours Login
detection:
  selection:
    EventID: 4624
    Hour: [0,1,2,3,4,5,22,23]
  condition: selection
## Result: 50 alerts/day. 90% false positive (night shift DBAs, offshore teams)

## Version 2: Add baseline exclusion
title: Off-Hours Login
detection:
  selection:
    EventID: 4624
    Hour: [0,1,2,3,4,5,22,23]
  filter:
    UserName|endswith: '_batch'  # Exclude service accounts
    UserName|startswith: 'dba_'   # Exclude known DBA accounts
  condition: selection and not filter
## Result: 10 alerts/day. 60% false positive (still catching offshore dev team)

## Version 3: Add geolocation and learning
title: Off-Hours Login
detection:
  selection:
    EventID: 4624
    Hour: [0,1,2,3,4,5,22,23]
  filter_known_users:
    UserName|endswith: '_batch'
  filter_baseline:
    UserName in known_offhours_users  # Dynamic lookup from UEBA baseline
  condition: selection and not filter_known_users and not filter_baseline
## Result: 3 alerts/day. 10% false positive. Actionable.
Coverage Mapping to MITRE ATT&CK
Map your detection rules to MITRE ATT&CK to identify gaps.
| Tactic | Technique | Technique ID | Detection Rule | Coverage Status |
|---|---|---|---|---|
| Initial Access | Phishing | T1566 | Email rule creation, suspicious attachment | 🟢 Covered |
| Initial Access | Valid Accounts | T1078 | Impossible travel, off-hours login | 🟢 Covered |
| Execution | Command and Scripting Interpreter | T1059 | PowerShell logging, LOLBIN execution | 🟢 Covered |
| Persistence | Account Manipulation | T1098 | Admin group addition, email forwarding | 🟢 Covered |
| Persistence | Create Account | T1136 | New local/domain account creation | 🟢 Covered |
| Privilege Escalation | Abuse Elevation Control Mechanism | T1548 | UAC bypass, sudo abuse | 🟡 Partial |
| Defense Evasion | Indicator Removal | T1070 | Log clearing (Event ID 1102) | 🟢 Covered |
| Credential Access | OS Credential Dumping | T1003 | LSASS access, SAM dump | 🟢 Covered |
| Discovery | Account Discovery | T1087 | AD enumeration, LDAP queries | 🔴 Not Covered |
| Lateral Movement | Remote Services | T1021 | RDP, SMB, PSExec, WMI | 🟢 Covered |
| Collection | Data from Local System | T1005 | Bulk file access, USB usage | 🟡 Partial |
| Exfiltration | Exfiltration Over C2 Channel | T1041 | Beaconing detection, DNS tunneling | 🟢 Covered |
| Impact | Data Encrypted for Impact | T1486 | Ransomware file extensions | 🟢 Covered |
Gap Analysis Action:
- If > 20% of techniques in a tactic are red, prioritize building rules for that tactic
- Focus on techniques with high prevalence in your threat intelligence
- Update coverage map quarterly
UEBA & Behavioral Analytics
User and Entity Behavior Analytics (UEBA) detects anomalies by establishing baselines of normal behavior and flagging deviations. It is essential for detecting insider threats, compromised credentials, and slow-and-low attacks that signature-based rules miss.
What UEBA Actually Does
| Function | Description | Example |
|---|---|---|
| Baseline establishment | Learns normal patterns for users, devices, and systems over time | "User Alice normally logs in from London 9 AM–5 PM, accesses 20 files/day, sends 50 emails/day" |
| Anomaly detection | Flags deviations from baseline | "Alice logged in from Moscow at 2 AM, accessed 500 files, and sent 0 emails" |
| Peer group analysis | Compares user to similar users | "Alice is in Finance. No one in Finance has ever accessed the Engineering code repository." |
| Risk scoring | Combines multiple anomalies into a single risk score | "Alice's risk score = 87/100 (high) due to impossible travel + off-hours access + bulk file access" |
| Entity tracking | Tracks risk across entities (user, device, IP, file) | "IP 203.0.113.45 has risk score 95 due to 5 failed accounts + 2 successful + malware download" |
| Session stitching | Links activities across sessions and devices | "Alice's session on laptop + RDP session on server + AWS console login are the same attacker" |
UEBA vs. Signature-Based Detection
| Aspect | Signature-Based (SIEM Rules) | UEBA (Behavioral) |
|---|---|---|
| What it detects | Known bad patterns | Unknown / unusual patterns |
| Requires | Threat intelligence, known IOCs | Baseline data, ML models |
| False positive rate | Low (if tuned) for known threats | Higher initially, improves with tuning |
| Time to value | Immediate (rule fires on match) | 2–4 weeks (needs baseline learning) |
| Best for | Known malware, brute force, known C2 | Insider threat, compromised credentials, APT |
| Cost | Lower (part of SIEM) | Higher (dedicated UEBA tool or SIEM module) |
Key UEBA Capabilities by Tool
| Tool | UEBA Approach | Unique Strength | Weakness |
|---|---|---|---|
| Splunk UBA | Dedicated ML models, entity-centric | Excellent entity resolution, risk scoring | expensive, requires separate license |
| Microsoft Sentinel UEBA | Built-in, free with Azure AD P2 | Native integration with Azure AD, Microsoft 365 | Limited to Microsoft ecosystem depth |
| Exabeam | Pure-play UEBA, timeline-based | Strong session stitching and timeline | expensive, complex deployment |
| Securonix | Cloud-native UEBA + SIEM | Strong cloud and SaaS coverage | Newer, smaller ecosystem |
| IBM QRadar UBA | Integrated with QRadar SIEM | Free with QRadar, good for insider threat | Less advanced than Exabeam or Splunk UBA |
| Elastic Security | ML-based anomaly detection | Open, customizable, part of Elastic stack | Requires ML expertise to tune effectively |
| Darktrace | Self-learning AI (network + endpoint) | Autonomous response, no rule writing | Black box, expensive, can be overly aggressive |
| Vectra AI | Network-focused AI detection | Excellent network detection, attacker lifecycle tracking | Network-only, requires TAP/SPAN |
Baseline Establishment Process
Phase 1: Data Collection (Week 1–2)
- Collect 30 days of activity data: logins, file access, email, web, application usage
- Ensure data quality: deduplicated, timestamped, actor-identified
- Include metadata: time, location, device, application, data sensitivity
Phase 2: Baseline Learning (Week 3–4)
- Calculate per-user baselines:
- Login times (hours, days of week)
- Geographic locations (cities, countries)
- Devices used (laptop, mobile, VDI)
- Applications accessed
- File access volume and patterns
- Data sensitivity levels accessed
- Email volume and external recipients
- Web categories visited
- Calculate peer group baselines (department, role, geography)
- Identify system-wide baselines (server traffic patterns, API baseline)
Phase 3: Threshold Setting (Week 5)
- Set anomaly thresholds:
- Statistical: 3-sigma deviation from mean
- Peer-based: Deviation from peer group median
- Temporal: Off-hours defined by individual work pattern
- Contextual: Unusual combination of activities
- Tune for false positives: Adjust thresholds until < 5% FP rate
Phase 4: Continuous Learning (Ongoing)
- Re-baseline quarterly
- Incorporate feedback from analyst investigations
- Adjust for role changes, seasonal patterns (quarter-end for finance)
- Retire old baselines for departed users
Risk Scoring Models
A practical risk scoring model combines multiple factors:
Risk Score = (Anomaly Score × Weight) + (Threat Intel Score × Weight) + (Asset Value × Weight)

Where:
- Anomaly Score (0–100): Deviation from baseline (login time, location, volume, peer group)
- Threat Intel Score (0–100): IOC match, known malicious IP, suspicious domain
- Asset Value (0–100): Sensitivity of data accessed (Public=0, Internal=20, Confidential=60, Highly Confidential=100)
- Weights: Typically 0.4, 0.3, 0.3
Example Risk Score Calculation:
| Factor | Value | Weight | Contribution |
|---|---|---|---|
| Anomaly: Login from new country (Russia) | 80 | 0.4 | 32 |
| Anomaly: Bulk file access (500 files vs. baseline 20) | 70 | 0.4 | 28 |
| Threat Intel: IP is Tor exit node | 90 | 0.3 | 27 |
| Asset Value: Accessed HR compensation data | 100 | 0.3 | 30 |
| Total Risk Score | 117 → Capped at 100 |
Risk Score Thresholds:
| Score | Priority | SLA | Response |
|---|---|---|---|
| 90–100 | Critical | 15 minutes | Immediate SOC escalation, disable account pending review |
| 70–89 | High | 1 hour | SOC analyst investigation, notify manager |
| 50–69 | Medium | 4 hours | Queue for daily review, automated email to user |
| 30–49 | Low | 24 hours | Weekly trend review, no immediate action |
| < 30 | Informational | None | Feed into baseline improvement |
Insider Threat Detection with UEBA
Insider threats are the hardest to detect because the actor has legitimate access. UEBA excels here.
| Insider Threat Type | Behavioral Indicators | UEBA Detection |
|---|---|---|
| The Resigner | Accessing HR folders, printing resume, off-hours access to IP | Baseline deviation: printing volume, unusual file access categories |
| The Data Thief | Bulk download of customer data, USB usage, email to personal address | Volume anomaly + data sensitivity + exfiltration channel |
| The Saboteur | Admin access to critical systems, configuration changes, backup deletion | Privileged action anomaly + off-hours + system criticality |
| The Negligent Insider | Sharing password, falling for phishing, using unapproved cloud storage | Policy violation + credential exposure indicators |
| The Compromised Insider | Account used by attacker from new location, simultaneous login | Impossible travel + credential abuse pattern |
Privacy Considerations:
- UEBA monitoring must be documented in privacy policy and employee agreements
- In EU, works councils may need to be consulted
- Avoid keystroke logging or screen recording without explicit legal basis
- Focus on data access patterns, not content (e.g., "accessed 500 files" not "read confidential merger document")
- Implement data minimization: only collect data needed for security
- Set retention limits: behavioral baselines should be deleted when user departs
💡 Practitioner tip: UEBA is not a "set and forget" tool. It requires 2–4 weeks of learning, then continuous tuning. Organizations that buy Exabeam or Splunk UBA and never tune it end up with 200 daily alerts and an ignored queue. Assign a dedicated analyst for the first 90 days to provide feedback and tune thresholds.
Cloud Monitoring
Cloud monitoring is no longer optional. For most organizations, cloud infrastructure is the primary, or only, infrastructure. Monitoring cloud-native services requires cloud-native tools and techniques.
AWS CloudTrail
CloudTrail is the audit log of AWS. Every API call is recorded.
Critical CloudTrail Configurations:
| Setting | Recommendation | Why |
|---|---|---|
| Multi-region trail | Enable in all regions | Attackers often operate in unused regions to evade detection |
| Organization trail | Enable at organization level | Captures all accounts in AWS Organization without per-account setup |
| Data events | Enable for S3 and Lambda | Read/write object-level events and Lambda function invocation |
| Insight events | Enable | Automatically detects unusual API call volumes (e.g., 20x baseline) |
| Log file validation | Enable | Cryptographically proves logs haven't been tampered |
| S3 bucket security | Separate account, versioning, MFA delete, access logging | Protects the audit log from deletion by compromised admin |
| Encryption | SSE-KMS with customer-managed key | Prevents AWS from accessing your logs |
CloudTrail Events to Alert On Immediately:
| Event Name | Risk | Detection Priority |
|---|---|---|
ConsoleLogin with MFAUsed: false and Root account | Root account without MFA | Critical |
CreateAccessKey for root or admin user | New API keys for privileged users | Critical |
DeleteTrail or StopLogging | CloudTrail tampering | Critical |
PutBucketPolicy / PutBucketAcl with public access | Public S3 bucket | Critical |
AuthorizeSecurityGroupIngress with 0.0.0.0/0 | Open security group | Critical |
AttachUserPolicy with AdministratorAccess | Privilege escalation | High |
CreateUser / CreateRole in unused region | Stealth account creation | High |
DeleteBucket / DeleteBucketPolicy | Data destruction | High |
PutBucketVersioning with Status: Suspended | Disabling versioning for ransomware | High |
PutBucketLifecycle with short expiration | Data destruction via lifecycle | Medium |
CloudTrail Log Analysis Example (Athena):
SELECT
    eventTime,
    eventName,
    userIdentity.arn,
    sourceIPAddress,
    requestParameters
FROM cloudtrail_logs
WHERE eventName IN ('DeleteTrail', 'StopLogging', 'PutBucketPolicy')
    AND eventTime > current_timestamp - interval '7' day
ORDER BY eventTime DESC;
AWS GuardDuty
GuardDuty is AWS's managed threat detection service. It uses ML and threat intelligence.
| Finding Type | Description | Action |
|---|---|---|
CredentialAccess:IAMUser/AnomalousBehavior | Unusual IAM user API activity | Investigate user, check for compromise |
CryptoCurrency:EC2/BitcoinTool.B!DNS | EC2 instance communicating with Bitcoin domain | Likely compromised instance, isolate |
DefenseEvasion:IAMUser/CloudTrailLoggingDeleted | CloudTrail deleted | Critical incident, investigate immediately |
Discovery:S3/AnomalousBehavior | Unusual S3 API activity | Check for data reconnaissance |
Exfiltration:IAMUser/AnomalousBehavior | Unusual data transfer patterns | Investigate for data exfiltration |
Impact:EC2/MaliciousDomainRequest.Reputation | EC2 requesting known malicious domain | Compromised instance |
PenTest:IAMUser/KaliLinux | API calls from Kali Linux | Could be pen test or attacker using Kali |
Persistence:IAMUser/AnomalousBehavior | IAM user persistence behavior | Check for new users, roles, policies |
Recon:IAMUser/NetworkPermissions | IAM user checking network permissions | Reconnaissance for lateral movement |
Stealth:S3/ServerAccessLoggingDeleted | S3 logging disabled | Check for cover-up activity |
GuardDuty Integration:
- Forward findings to SIEM via EventBridge → Kinesis → Lambda → SIEM
- Use Security Hub for centralized AWS security findings
- Integrate with SOAR for automated response (e.g., isolate EC2 on GuardDuty finding)
Azure Monitor & Sentinel
Azure's monitoring stack is deeply integrated. Azure Monitor collects logs and metrics. Sentinel analyzes them.
Azure Monitor Data Sources:
| Source | Data Type | Collection Method |
|---|---|---|
| Azure Activity Log | Control plane events (resource creation, RBAC) | Native, automatically collected |
| Azure AD Sign-in Logs | Authentication events | Azure AD Diagnostic Settings → Log Analytics |
| Azure AD Audit Logs | Directory changes (user, group, app) | Azure AD Diagnostic Settings → Log Analytics |
| Azure VM | OS events, performance | Azure Monitor Agent or Log Analytics agent |
| Azure NSG | Network flow logs | NSG Flow Logs → Storage Account → Log Analytics |
| Azure Firewall | Traffic logs, application rules | Diagnostic Settings → Log Analytics |
| Azure Key Vault | Access and audit events | Diagnostic Settings → Log Analytics |
| Azure Storage | Storage analytics logs | Storage diagnostic settings |
| Azure Kubernetes | Control plane, container logs | Container Insights, Diagnostic Settings |
| Microsoft 365 | Exchange, SharePoint, Teams audit | Microsoft 365 Defender connector |
| Non-Azure sources | On-prem, AWS, GCP | Log Analytics agent, CEF collector, AMA, Azure Arc |
Azure Sentinel Key Tables:
| Table | Content | Use Case |
|---|---|---|
SecurityAlert | Alerts from Microsoft and partner products | Centralized alert management |
SecurityEvent | Windows Security events (Sysmon, 4688, etc.) | Endpoint detection |
SigninLogs | Azure AD sign-in events | Account compromise detection |
AuditLogs | Azure AD directory changes | Privilege escalation |
AzureActivity | Azure control plane | Cloud misconfiguration exploitation |
CommonSecurityLog | CEF-formatted logs (firewalls, proxies) | Network security |
DeviceLogonEvents | Defender for Endpoint logon events | Endpoint detection |
DeviceNetworkEvents | Defender for Endpoint network events | Network beaconing, C2 |
DeviceFileEvents | Defender for Endpoint file events | Malware, ransomware |
OfficeActivity | Microsoft 365 audit | Insider threat, email exfiltration |
AWSCloudTrail | AWS CloudTrail via connector | Multi-cloud monitoring |
GCP Security Command Center
GCP's security monitoring is centered around Security Command Center (SCC).
| SCC Feature | Description | Tier |
|---|---|---|
| Asset Inventory | Continuous discovery of GCP resources | Free |
| Security Sources | Findings from Security Health Analytics, Web Security Scanner, Container Analysis | Free |
| Vulnerability Discovery | OS and container vulnerability scanning | Premium |
| Threat Detection | Built-in threat detection (Crypto mining, brute force, data exfiltration) | Premium |
| Event Threat Detection | Detects threats in Cloud Logging (analogous to GuardDuty) | Premium |
| Container Threat Detection | Detects container runtime threats (analogous to Falco) | Premium |
GCP Cloud Audit Logs (Critical for Monitoring):
| Log Type | Scope | Key Events |
|---|---|---|
| Admin Activity | Administrative actions on resources | IAM changes, resource creation/deletion, policy changes |
| Data Access | Read/write operations on user data | BigQuery queries, Cloud Storage object access, SQL queries |
| System Event | Automated Google system events | Instance migration, maintenance, encryption key rotation |
| Policy Denied | Access denied due to IAM policy | Failed authorization attempts, reconnaissance |
GCP Log Analysis Example (BigQuery):
SELECT
  timestamp,
  protoPayload.authenticationInfo.principalEmail,
  protoPayload.methodName,
  protoPayload.resourceLabels.project_id,
  protoPayload.serviceData.policyDelta.auditConfigDeltas
FROM `project-id.audit_logs.cloudaudit_googleapis_com_data_access`
WHERE protoPayload.methodName LIKE 'setIamPolicy'
  AND timestamp > TIMESTAMP_SUB(CURRENT_TIMESTAMP(), INTERVAL 7 DAY)
ORDER BY timestamp DESC;
Multi-Cloud Monitoring Strategy
Most mid-to-large organizations use multiple clouds. A unified monitoring approach is essential.
Architecture Pattern: Centralized Cloud SIEM with Cloud-Native Feeds
┌────────────────────────────────────────────────────────────────────┐
│                    CENTRAL SIEM (Splunk / Sentinel / Elastic)       │
│  ┌─────────────┐  ┌─────────────┐  ┌─────────────┐  ┌──────────┐ │
│  │ Correlation │  │ Detection   │  │ Cases       │  │ Reporting│ │
│  │ Engine      │  │ Rules       │  │             │  │          │
│  └─────────────┘  └─────────────┘  └─────────────┘  └──────────┘ │
└────────────────────────────────────────────────────────────────────┘
                              ▲
        ┌─────────────────────┼─────────────────────┐
        │                     │                     │
┌───────┴───────┐   ┌─────────┴─────────┐   ┌───────┴───────┐
│   AWS LANDING │   │   AZURE LANDING   │   │   GCP LANDING │
│   ZONE        │   │   ZONE            │   │   ZONE        │
│               │   │                   │   │               │
│ CloudTrail →  │   │ Activity Log →    │   │ Cloud Audit → │
│ Kinesis →    │   │ Event Hub →        │   │ Pub/Sub →     │
│ Lambda →     │   │ Function →          │   │ Function →    │
│ SIEM         │   │ SIEM                │   │ SIEM          │
│               │   │                   │   │               │
│ GuardDuty →  │   │ Defender for →      │   │ SCC →         │
│ SecurityHub →│   │ Cloud → SIEM        │   │ SIEM          │
│ SIEM         │   │                   │   │               │
└───────────────┘   └───────────────────┘   └───────────────┘
Multi-Cloud Monitoring Challenges:
| Challenge | Solution |
|---|---|
| Different log formats | Normalize to common schema (ECS or ASIM) at ingestion |
| Different event models | Create unified detection rules that work across cloud event types |
| Cross-cloud correlation | Use SIEM correlation engine with entity resolution (same user across AWS + Azure) |
| Data egress costs | Use cloud-native aggregation before cross-cloud transfer; use private interconnect |
| IAM for monitoring | Create least-privilege monitoring roles in each cloud with read-only access |
| Alert fatigue | Centralize alert management, deduplicate cross-cloud findings |
CSPM Integration with Monitoring
Cloud Security Posture Management (CSPM) finds misconfigurations. Monitoring detects exploitation. They must work together.
| CSPM Tool | Monitoring Integration | Value |
|---|---|---|
| Prisma Cloud | Sends alerts to SIEM, correlates with runtime threats | Detects misconfiguration → exploitation chain |
| Wiz | Integrates with SIEM, provides graph-based risk | Exploit path visualization |
| Orca Security | Side-scanning + alert integration | Agentless monitoring with threat detection |
| Microsoft Defender for Cloud | Native Sentinel integration | Unified Azure security posture + threat detection |
| AWS Security Hub | Centralizes GuardDuty, Inspector, Macie findings | Single pane for AWS security |
| Datadog CSPM | Unified with Datadog Security Monitoring | Security + observability in one platform |
Example CSPM → Monitoring Workflow:
- CSPM detects S3 bucket is public (prisma:public-s3-bucket)
- SIEM receives CSPM alert, creates low-priority ticket
- CloudTrail shows
GetObjectoperations on that bucket from unknown IP - SIEM correlates CSPM alert + CloudTrail anomaly → Critical alert
- SOAR automatically blocks IP and restricts bucket policy
💡 Practitioner tip: A common cloud monitoring gap is organizations enabling CloudTrail but never reviewing it. CloudTrail without alerting is just expensive storage. At minimum, set up alerts for
ConsoleLogin,DeleteTrail,PutBucketPolicy, andAuthorizeSecurityGroupIngress. These 4 events cover 80% of critical cloud security incidents.
Kubernetes & Container Monitoring
Containers and Kubernetes have unique monitoring challenges: ephemeral infrastructure, shared kernels, and complex networking. Standard host-based monitoring is insufficient.
Kubernetes Audit Logs
K8s audit logs record every request to the API server. They are the CloudTrail of Kubernetes.
Enabling K8s Audit Logs:
For managed K8s (EKS, AKS, GKE), audit logs are partially enabled. For self-managed K8s, you must configure the API server.
## /etc/kubernetes/audit-policy.yaml
apiVersion: audit.k8s.io/v1
kind: Policy
rules:
  # Log all requests at the Metadata level
  - level: Metadata
    omitStages:
      - RequestReceived

  # Log pod changes at RequestResponse level
  - level: RequestResponse
    resources:
      - group: ""
        resources: ["pods", "pods/status", "pods/log"]
    omitStages:
      - RequestReceived

  # Log secret access at RequestResponse
  - level: RequestResponse
    resources:
      - group: ""
        resources: ["secrets"]
    omitStages:
      - RequestReceived

  # Log RBAC changes at RequestResponse
  - level: RequestResponse
    resources:
      - group: "rbac.authorization.k8s.io"
        resources: ["roles", "rolebindings", "clusterroles", "clusterrolebindings"]
    omitStages:
      - RequestReceived

  # Log exec and attach at RequestResponse
  - level: RequestResponse
    resources:
      - group: ""
        resources: ["pods/exec", "pods/attach"]
    omitStages:
      - RequestReceived

  # Don't log health checks
  - level: None
    nonResourceURLs:
      - /healthz
      - /livez
      - /readyz
Critical K8s Audit Events to Monitor:
| Verb | Resource | Risk | Detection Priority |
|---|---|---|---|
create | pods | New pod creation (could be malicious workload) | Medium |
delete | pods | Pod deletion (disruption) | Medium |
create | pods/exec | exec into running pod (lateral movement, data access) | High |
create | pods/attach | attach to running pod | High |
create | secrets | Secret creation (could be exfiltration staging) | Medium |
get | secrets | Secret reading (credential theft) | High |
create | roles / rolebindings | Privilege escalation within namespace | High |
create | clusterroles / clusterrolebindings | Cluster-wide privilege escalation | Critical |
create | serviceaccounts | New service account (persistence) | Medium |
patch | deployments | Deployment modification (could inject sidecar) | High |
delete | events | Event deletion (cover-up) | Critical |
delete | auditpolicies | Audit policy tampering | Critical |
Example K8s Audit Alert (Falco + Fluent Bit):
## falco rule
- rule: Unauthorized K8s Secret Access
  desc: Detect reading secrets by non-service-account users
  condition: >
    k8s.audit.user != "system:serviceaccount:*" and
    k8s.audit.verb in ("get", "list") and
    k8s.audit.objectref.resource = "secrets"
  output: "Unauthorized secret access by user=%k8s.audit.user resource=%k8s.audit.objectref.name"
  priority: HIGH
Falco, Runtime Security
Falco is the open-source runtime security engine for containers. It detects unexpected behavior using system calls.
Falco Deployment Options:
| Method | Pros | Cons |
|---|---|---|
| DaemonSet | Standard K8s deployment, easy to manage | Resource overhead on every node |
| Sidecar | Per-pod monitoring, no node access needed | More complex, higher total resource |
| eBPF probe | Modern, no kernel module | Requires recent kernel, eBPF support |
| Kernel module | Traditional, broad compatibility | Kernel compatibility issues, less secure |
| gVisor | Sandbox-level monitoring | Performance overhead, limited adoption |
Critical Falco Rules for Production:
## falco_rules.local.yaml
- rule: Privileged Container Started
  desc: Detect privileged container creation
  condition: >
    spawned_process and
    container.privileged = true
  output: "Privileged container started: %container.name"
  priority: CRITICAL

- rule: Sensitive File Access in Container
  desc: Detect access to /etc/shadow, /etc/passwd
  condition: >
    spawned_process and
    (proc.name in ("cat", "less", "more", "vim")) and
    (fd.name contains "/etc/shadow" or fd.name contains "/etc/passwd")
  output: "Sensitive file access: %proc.name %fd.name %container.name"
  priority: HIGH

- rule: Outbound Connection from Sensitive Container
  desc: Database containers should not make outbound connections
  condition: >
    outbound and
    container.name contains "database" and
    fd.type = "ipv4"
  output: "Outbound connection from database container: %container.name %fd.name"
  priority: HIGH

- rule: Shell Spawned in Container
  desc: Detect interactive shell in container
  condition: >
    spawned_process and
    shell_procs and
    container.id != "host"
  output: "Shell spawned in container: %proc.name %container.name"
  priority: MEDIUM
Admission Controllers
Admission controllers intercept requests to the K8s API server before persistence. They enforce policy.
| Controller | Purpose | Security Value |
|---|---|---|
| OPA Gatekeeper | Policy enforcement using Rego language | Prevent privileged containers, enforce resource limits, require labels |
| Kyverno | Native K8s policy engine | Easier to write than Rego, mutate resources, validate configs |
| Pod Security Admission (PSA) | Built-in K8s pod security | Enforce Pod Security Standards (Privileged, Baseline, Restricted) |
| Network Policies | L3/L4 network segmentation | Prevent lateral movement between pods and namespaces |
| Cert-Manager | Automated TLS certificate management | Ensure all services use valid TLS |
Kyverno Policy Example (Block Privileged Containers):
apiVersion: kyverno.io/v1
kind: ClusterPolicy
metadata:
  name: disallow-privileged
spec:
  validationFailureAction: enforce
  rules:
  - name: validate-privileged
    match:
      resources:
        kinds:
        - Pod
    validate:
      message: "Privileged containers are forbidden"
      pattern:
        spec:
          containers:
          - securityContext:
              =(privileged): "false"
Container Runtime Security
Beyond Falco, additional runtime security layers:
| Tool | Approach | Use Case |
|---|---|---|
| Sysdig | System call capture + analysis | Deep forensics, compliance recording |
| Trivy | Container image scanning | Detect CVEs in images before deployment |
| Snyk Container | Image + dependency scanning | Developer-friendly vulnerability management |
| Anchore | Policy-based image scanning | Enterprise image compliance |
| Aqua Security | Full container security platform | Runtime protection, image scanning, network micro-segmentation |
| Twistlock (Prisma Cloud) | Palo Alto container security | Integrated with Prisma Cloud for full cloud security |
Service Mesh Monitoring
Service meshes (Istio, Linkerd) provide mTLS, traffic management, and observability.
| Mesh Feature | Security Monitoring Value |
|---|---|
| mTLS everywhere | Every service-to-service call is authenticated. Monitor for mTLS failures (policy violations). |
| Access policies | AuthorizationPolicy resources control who can talk to whom. Monitor for policy denials. |
| Request telemetry | Every request generates metrics and logs. Monitor for unusual latency, error rates, or request volumes. |
| Ingress gateway | Centralized entry point. Monitor for DDoS, injection attempts, unusual geographic distribution. |
Istio Security Monitoring:
## Monitor for mTLS policy violations
apiVersion: security.istio.io/v1beta1
kind: PeerAuthentication
metadata:
  name: default
  namespace: production
spec:
  mtls:
    mode: STRICT
## Any connection without mTLS will be rejected and logged
Network Policies
K8s NetworkPolicies are firewall rules for pods. Monitoring them is essential.
| Policy Type | Purpose | Monitor For |
|---|---|---|
| Deny-all default | Block all ingress/egress by default | Any traffic that should be blocked but isn't |
| Namespace isolation | Only allow same-namespace traffic | Cross-namespace traffic (lateral movement) |
| Egress control | Restrict outbound connections | Unexpected outbound connections (C2, exfiltration) |
| Ingress whitelist | Only allow specific sources | Connections from unauthorized sources |
Monitoring Network Policy Violations:
- Calico:
calico-policy-controllerlogs denied packets - Cilium:
cilium monitorshows policy drops - Weave:
weave-npclogs denied connections - Log these to SIEM and alert on denied connection attempts from sensitive namespaces
💡 Practitioner tip: Most organizations deploying Kubernetes monitor pod CPU and memory but not K8s audit logs. The K8s API server is the control plane, every attack on K8s goes through it. Enable K8s audit logs, forward them to your SIEM, and alert on
pods/exec,secrets/get, andclusterrolebindings/create. These 3 events catch 80% of K8s attacks.
Database Monitoring
Databases contain the crown jewels. ISO 27001 does not prescribe database activity monitoring, but it is strongly recommended for systems holding sensitive data.
Database Audit Log Categories
| Category | What to Log | Why |
|---|---|---|
| Authentication | Successful and failed logins, logouts, session duration | Account compromise detection |
| Authorization | Privilege changes, role grants, permission changes | Privilege escalation detection |
| Schema changes | CREATE, ALTER, DROP table, index, view | Unauthorized data structure changes |
| Data access | SELECT, INSERT, UPDATE, DELETE on sensitive tables | Data theft, unauthorized access |
| Data changes | DML on sensitive tables | Data tampering, integrity violations |
| Admin activity | DBA commands, backup/restore, configuration changes | Insider threat, operational risk |
| Query performance | Slow queries, full table scans, connection spikes | Reconnaissance, DoS, abuse |
Database Activity Monitoring (DAM) Tools
DAM tools sit between the database and the application, monitoring all traffic without modifying the database.
| Tool | Deployment | Database Support | Key Strength |
|---|---|---|---|
| GreenSQL | Proxy | MySQL, PostgreSQL | Open-source option, basic SQL injection detection |
Native Database Audit Configuration
PostgreSQL (pgaudit):
-- Install pgaudit extension
CREATE EXTENSION pgaudit;

-- Configure pgaudit in postgresql.conf
pgaudit.log = 'write, ddl, role'
pgaudit.log_catalog = off
pgaudit.log_parameter = on
pgaudit.log_statement_once = off
pgaudit.log_level = log

-- Audit specific tables
CREATE TABLE sensitive_customers (...);
ALTER TABLE sensitive_customers SET (pgaudit.log = 'all');
Microsoft SQL Server (SQL Server Audit):
-- Create server audit
USE master;
CREATE SERVER AUDIT ComplianceAudit
TO FILE (FILEPATH = 'D:\SQLAudit\', MAXSIZE = 100 MB, MAX_ROLLOVER_FILES = 10)
WITH (ON_FAILURE = CONTINUE);
ALTER SERVER AUDIT ComplianceAudit WITH (STATE = ON);

-- Create database audit specification
USE ProductionDB;
CREATE DATABASE AUDIT SPECIFICATION SensitiveDataAudit
FOR SERVER AUDIT ComplianceAudit
ADD (SELECT, INSERT, UPDATE, DELETE ON dbo.Customers BY public)
WITH (STATE = ON);
Oracle (Unified Audit Policy):
-- Create unified audit policy
CREATE AUDIT POLICY monitor_sensitive_data
ACTIONS SELECT, INSERT, UPDATE, DELETE ON hr.employees,
        SELECT, INSERT, UPDATE, DELETE ON hr.salary_data
WHEN 'SYS_CONTEXT(''USERENV'', ''SESSION_USER'') != ''HR_APP'''
EVALUATE PER STATEMENT;

-- Enable policy
AUDIT POLICY monitor_sensitive_data;
Query Analysis for Security
Monitor query patterns for signs of abuse:
| Pattern | Detection | Security Concern |
|---|---|---|
SELECT * FROM customers without WHERE | Full table scan on sensitive table | Data scraping, unauthorized bulk access |
UNION SELECT in application query | SQL injection attempt | Active attack |
INTO OUTFILE / BULK INSERT | Data export to file | Data exfiltration preparation |
DROP TABLE, TRUNCATE TABLE | Destructive DDL | Sabotage, ransomware |
CREATE USER, GRANT DBA | Privilege escalation | Unauthorized admin access |
| Queries from unusual application | App not in whitelist connecting to DB | Compromised application server |
| Connection spike from single IP | >100 connections in 1 minute | Brute force, DoS |
| Long-running queries during off-hours | Query running >1 hour at 2 AM | Batch data theft |
Database Access Pattern Monitoring
Establish baselines for database access:
| Baseline Element | How to Measure | Anomaly Detection |
|---|---|---|
| Connection sources | Which IPs/applications connect | New source IP = anomaly |
| Connection times | When is database normally accessed | Off-hours access = anomaly |
| Query volume | Queries per hour per user/application | 3x volume spike = anomaly |
| Table access patterns | Which tables each app/user normally queries | New table access = anomaly |
| Query complexity | Average rows returned, join count | Full table scan on large table = anomaly |
| Privilege usage | Which privileges are normally used | Elevated privilege use = anomaly |
DLP for Databases
Database DLP prevents sensitive data from leaving the database environment.
| DLP Function | Implementation | Example Tool |
|---|---|---|
| Data classification | Tag columns with sensitivity level | Imperva, IBM Guardium, Microsoft Purview |
| Query inspection | Block or alert on queries returning sensitive data | Imperva SecureSphere, Oracle Database Vault |
| Masking / redaction | Return masked data to unauthorized users | Oracle Data Redaction, IBM Guardium, Dynamic Data Masking (SQL Server) |
| Blocking | Prevent unauthorized SELECT on sensitive tables | Database firewall (Imperva, GreenSQL) |
| Alerting | Alert when sensitive data is accessed in bulk | DAM tools, native audit |
💡 Practitioner tip: Database monitoring is the most commonly neglected area in ISO 27001 implementations. Organizations monitor firewalls and endpoints but treat databases as "internal" and safe. The majority of data breaches involve database compromise. At minimum, enable native database audit logs, forward them to your SIEM, and alert on failed logins, privilege changes, and off-hours access. Native audit is free, use it.
Network Monitoring
Network monitoring is the foundation of security visibility. Even in a zero-trust world, network telemetry reveals attacker movement, data exfiltration, and command-and-control communication.
NetFlow, sFlow, and IPFIX
Flow protocols summarize network traffic metadata without capturing full packets.
| Protocol | Layer | Key Fields | Best For | Typical Collector |
|---|---|---|---|---|
| NetFlow v5 | L3/L4 | Source/dest IP, port, protocol, bytes, packets | Basic traffic analysis, Cisco environments | ElastiFlow, ntopng, Plixer |
| NetFlow v9 | L3/L4 + options | Flexible templates, application IDs, QoS | Modern Cisco, detailed traffic categorization | ElastiFlow, Cisco Stealthwatch |
| IPFIX | L3/L4 + extensible | Standardized extensible format, deep packet inspection fields | Multi-vendor, modern networks | ElastiFlow, ntopng, Flowmon |
| sFlow | L2/L3/L4 | Packet sampling + counter sampling | High-speed networks, real-time visibility | sFlow-RT, ntopng, InMon |
| VPC Flow Logs | L3/L4 | Cloud-native version of NetFlow | AWS, Azure, GCP network visibility | Cloud-native (Athena, BigQuery) or SIEM |
Flow Analysis for Security:
| Anomaly | Flow Indicator | Attack Phase |
|---|---|---|
| C2 beaconing | Regular 60-second connections to same external IP | Post-exploitation |
| Data exfiltration | Large outbound flow to new external IP | Exfiltration |
| Lateral movement | Internal flows between unusual host pairs | Lateral movement |
| Port scan | Many destination ports from single source | Reconnaissance |
| DDoS | Many source IPs, same destination, high packet rate | Impact |
| Tunneling | DNS or ICMP flows with high byte count | Exfiltration / C2 |
| Tor exit node | Connection to known Tor exit list | Anonymization |
Packet Capture (Full PCAP)
Full packet capture provides the deepest visibility but at the highest cost.
| Use Case | Capture Strategy | Retention | Tools |
|---|---|---|---|
| Incident response | Capture on-demand or triggered by alert | 24–72 hours | tcpdump, Wireshark, Moloch/Arkime |
| Threat hunting | Selective capture on critical segments | 7–30 days | Arkime, Stenographer, Netresec |
| Compliance | Full capture on regulated segments | 30–90 days | Endace, Niksun, Gigamon |
| Performance analysis | Sampled capture (1:1000) | 1–7 days | ntopng with nDPI |
Arkime (Open-Source PCAP Analysis):
- High-performance full packet capture and indexing
- Web-based search and session reconstruction
- Supports 10Gbps+ capture rates
- Integrates with YARA for file extraction
- Cost: free (open source), requires significant storage infrastructure
Storage Calculation for PCAP:
1 Gbps network = 125 MB/s = 450 GB/hour = 10.8 TB/day = 324 TB/month
At 10 Gbps: 108 TB/day = 3.2 PB/month

Solution: Capture only on critical segments, use flow for everything else, trigger PCAP on alert.
IDS / IPS
Intrusion Detection Systems (IDS) and Intrusion Prevention Systems (IPS) inspect traffic for known attack signatures.
| Tool | Type | Deployment | Best For | Cost |
|---|---|---|---|---|
| Snort | IDS/IPS | Network sensor, inline or tap | Open-source IDS, community rules | Free (community rules) |
| Suricata | IDS/IPS/NSM | Network sensor, high performance | High-speed networks, full packet capture integration | Free (ET rules) |
| Zeek (Bro) | NSM | Network sensor, passive | Protocol analysis, behavioral detection, traffic parsing | Free |
Suricata Rule Example (C2 Beaconing):
    msg:"SUSPICIOUS TLS SNI - DGA Pattern";
    classtype:trojan-activity; sid:1000001; rev:1;
)
Zeek Script Example (Detect RDP over Non-Standard Port):
## rdp_anomaly.zeek
event RDP::client_connect(c: connection)
    {
        {
        }
    }
Network Detection and Response (NDR)
NDR tools use AI/ML to detect network anomalies without signatures or decryption.
| Tool | Approach | Deployment | Key Strength |
|---|---|---|---|
| Darktrace | Self-learning AI, "Enterprise Immune System" | Network TAP/SPAN | Autonomous response, no rules needed, detects unknown threats |
| Vectra AI | AI-driven network detection, attacker lifecycle | Network TAP/SPAN or cloud mirroring | Strong lateral movement detection, SaaS coverage |
| Cisco Secure Network Analytics (Stealthwatch) | NetFlow analysis + behavioral analytics | NetFlow/sFlow collection | Cisco ecosystem integration, good for enterprise |
| ExtraHop Reveal(x) | Network traffic analysis + decryption | Network TAP/SPAN | Deep payload inspection, decryption capability, cloud-native option |
| Corelight (Zeek commercial) | Open NDR platform based on Zeek | Network sensor | Zeek ecosystem, open detection, extensible |
| Gigamon ThreatINSIGHT | Network traffic + metadata analysis | Gigamon visibility fabric | Network visibility + threat detection combo |
NDR vs. IDS/IPS:
| Aspect | IDS/IPS | NDR |
|---|---|---|
| Detection method | Signatures, known patterns | Behavioral, ML-based, anomaly detection |
| Encrypted traffic | Blind to encrypted (unless SSL inspection) | Can detect anomalies in encrypted traffic metadata |
| Known vs. unknown | Known threats | Unknown threats |
| Deployment | Inline or passive | Passive only (TAP/SPAN) |
| Response | Can block (IPS) | Alerts only (response via SOAR or firewall integration) |
| Maintenance | Requires rule updates | Requires tuning and learning period |
| Cost | Lower | Higher |
Best practice: Run both. IDS/IPS for known threats and blocking. NDR for unknown threats and behavioral detection.
Encrypted Traffic Analysis
With 90%+ of web traffic encrypted, traditional deep packet inspection is increasingly ineffective.
| Technique | What It Reveals | Implementation |
|---|---|---|
| TLS fingerprinting | Client hello parameters, cipher suites, SNI | JA3/JA3S hashes. Malware often has unique TLS fingerprints. |
| SNI analysis | Domain name in TLS handshake | Block or alert on suspicious SNI patterns (DGA, young domains) |
| Traffic timing analysis | Inter-arrival times, flow duration | Beaconing detection without decrypting payload |
| Packet size analysis | Byte distribution, entropy | Encrypted C2 often has distinct packet size patterns |
| DNS over HTTPS (DoH) detection | DoH resolver IPs, timing patterns | Block known DoH IPs, detect anomalous HTTPS to DNS-like ports |
| SSL/TLS inspection | Full decryption for inspection | Legal/privacy concerns, certificate pinning breaks, performance impact |
JA3 Fingerprinting Example:
## JA3 is a TLS fingerprint based on Client Hello
## Normal Chrome: ja3=769,47-53-5-10-49161-49162-49171-49172-50-56-19-4,0-10-11,23-24-25,0
## Metasploit: ja3=769,53-47-5-10-49161-49162-49171-49172-50-56-19-4,65281-0-11-35-5-16,23-24-25,0
## Alert when JA3 matches known malware fingerprint
DNS Monitoring
DNS is the most underutilized monitoring source. 80% of malware uses DNS for C2.
| DNS Monitoring Technique | What It Detects | Implementation |
|---|---|---|
| Query logging | All DNS queries and responses | Enable logging on DNS servers (BIND, Windows DNS, Infoblox) |
| NXDOMAIN rate | DGA domains (malware generating random domains) | Alert on >100 NXDOMAIN/hour from single host |
| TXT record size | DNS tunneling (data encoded in TXT records) | Alert on TXT records >200 bytes |
| Query volume anomaly | DNS tunneling or C2 beaconing | Baseline queries per host, alert on 10x spike |
| Domain age | Newly registered domains | Alert on queries to domains < 7 days old |
| Threat intelligence | Known malicious domains | Integrate DNS logs with threat intel feeds (e.g., MISP) |
| DNS over HTTPS / TLS | Bypassing DNS monitoring | Block DoH/DoT at firewall, detect anomalous HTTPS to port 443 of known DNS IPs |
DNS Logging Configuration (Windows DNS):
## Enable debug logging (not for production scale, use analytic logs for scale)
dnscmd /Config /LogLevel 0x8100F331
## Or use Windows DNS Analytical Logs (Event ID 1000+)
## Enable in DNS Manager → Properties → Event Logging → Analytical
DNS Monitoring Alert Example (KQL):
// Detect potential DGA activity
DNS_Logs
| where TimeGenerated > ago(1h)
| summarize QueryCount=count(), UniqueDomains=dcount(QueryName) by ClientIP
| where QueryCount > 100 and UniqueDomains > 50
| extend DGAScore = QueryCount * UniqueDomains
| where DGAScore > 5000
| project ClientIP, QueryCount, UniqueDomains, DGAScore
| sort by DGAScore desc
💡 Practitioner tip: If you do one thing for network monitoring this quarter, enable DNS query logging and forward it to your SIEM. DNS is free telemetry that catches malware C2, data exfiltration, and phishing. Most organizations already have DNS infrastructure, they just don't log it. BIND, Windows DNS, and Infoblox all support query logging. Turn it on.
Endpoint Monitoring
Endpoints are where attacks begin and where data resides. EDR/XDR provides the granular visibility needed to detect and respond to endpoint threats.
EDR / XDR Landscape
| Product | Vendor | Deployment | Key Strength |
|---|---|---|---|
| Wazuh | Open source | Open source agent | Free, includes FIM, rootkit detection, active response |
EDR Data Sources
Modern EDRs collect extensive telemetry:
| Telemetry Type | What It Captures | Security Value |
|---|---|---|
| Process execution | Every process start, parent-child relationships, command line | Malware execution, LOLBIN usage, living-off-the-land |
| File system activity | File creation, modification, deletion, renaming | Ransomware file activity, data staging, persistence |
| Registry changes | Registry key creation, modification, deletion | Persistence mechanisms, configuration changes |
| Network connections | Every outbound connection, DNS query, listening port | C2 beaconing, data exfiltration, lateral movement |
| DLL/module loads | Every DLL loaded into a process | DLL injection, hooking, code injection |
| Memory injection | WriteProcessMemory, VirtualAllocEx, CreateRemoteThread | Process hollowing, code injection |
| Authentication | Logon events, token escalation, privilege changes | Pass-the-hash, token impersonation, privilege escalation |
| Script execution | PowerShell, WMI, VBScript, JavaScript, Python | Living-off-the-land, script-based malware |
| API calls | Key Windows API calls (NtCreateThreadEx, etc.) | Advanced malware behavior |
Sysmon, The Essential Windows Telemetry
Sysmon is a free Microsoft tool that provides deep Windows telemetry. Every EDR uses Sysmon-like data. Even with a commercial EDR, Sysmon provides independent visibility.
Critical Sysmon Event IDs:
| Event ID | Description | Detection Value |
|---|---|---|
| 1 | Process creation | Baseline execution, LOLBIN detection, malware execution |
| 2 | Process changed file creation time | Timestomping (anti-forensics) |
| 3 | Network connection | C2 beaconing, data exfiltration, lateral movement |
| 5 | Process terminated | Process lifecycle, cleanup after infection |
| 6 | Driver loaded | Rootkit loading, malicious driver |
| 7 | Image loaded | DLL injection, malicious DLL loading |
| 8 | CreateRemoteThread detected | Code injection, process hollowing |
| 9 | RawAccessRead detected | Direct disk access (anti-forensics, MFT access) |
| 10 | ProcessAccess | Credential dumping (LSASS access), process injection |
| 11 | File created | Ransomware file extension changes, data staging |
| 12/13/14 | Registry events | Persistence (Run keys, services), configuration changes |
| 15 | FileCreateStreamHash | Alternate Data Streams (ADS), malware hiding |
| 17/18 | Pipe events | Named pipe usage (IPC, Cobalt Strike) |
| 19/20/21 | WMI events | WMI persistence, WMI-based lateral movement |
| 22 | DNS query | C2 via domain, DGA detection |
| 23 | File deleted | File deletion (ransomware note, cleanup) |
| 25 | Process tampering | Process hollowing, herpaderping |
| 26 | File deleted (logged) | Detailed file deletion logging |
| 27 | FileBlockExecutable | Block executable file creation (if configured) |
| 28 | FileBlockShredding | Block file shredding (if configured) |
| 29 | FileExecutableDetected | Executable file detected (for detection) |
Sysmon Configuration (Best Practice, SwiftOnSecurity):
<!-- sysmonconfig-export.xml by SwiftOnSecurity -->
<Sysmon schemaversion="4.90">
  <HashAlgorithms>sha256,IMPHASH</HashAlgorithms>
  <EventFiltering>
    <!-- Process creation -->
    <RuleGroup name="Process Creation" groupRelation="or">
      <ProcessCreate onmatch="include">
        <Image condition="begin with">C:\Windows\</Image>
        <Image condition="begin with">C:\Users\</Image>
        <CommandLine condition="contains">powershell</CommandLine>
        <CommandLine condition="contains">certutil</CommandLine>
        <CommandLine condition="contains">bitsadmin</CommandLine>
      </ProcessCreate>
    </RuleGroup>

    <!-- Network connections -->
    <RuleGroup name="Network Connections" groupRelation="or">
      <NetworkConnect onmatch="include">
        <DestinationPort condition="is">443</DestinationPort>
        <DestinationPort condition="is">80</DestinationPort>
        <DestinationPort condition="is">53</DestinationPort>
      </NetworkConnect>
    </RuleGroup>

    <!-- Registry events -->
    <RuleGroup name="Registry Events" groupRelation="or">
      <RegistryEvent onmatch="include">
        <TargetObject condition="contains">Run</TargetObject>
        <TargetObject condition="contains">RunOnce</TargetObject>
        <TargetObject condition="contains">Shell</TargetObject>
      </RegistryEvent>
    </RuleGroup>

    <!-- File creation -->
    <RuleGroup name="File Creation" groupRelation="or">
      <FileCreate onmatch="include">
        <TargetFilename condition="end with">.exe</TargetFilename>
        <TargetFilename condition="end with">.dll</TargetFilename>
        <TargetFilename condition="end with">.ps1</TargetFilename>
      </FileCreate>
    </RuleGroup>

    <!-- Process access (credential dumping) -->
    <RuleGroup name="Process Access" groupRelation="or">
      <ProcessAccess onmatch="include">
        <TargetImage condition="is">C:\Windows\system32\lsass.exe</TargetImage>
        <GrantedAccess condition="contains">0x1010</GrantedAccess>
      </ProcessAccess>
    </RuleGroup>
  </EventFiltering>
</Sysmon>
EDR + SIEM + NDR Correlation
The power of modern security monitoring comes from correlating endpoint, network, and cloud data.
Correlation Example: Detecting Ransomware
| Time | Source | Event | Correlation Value |
|---|---|---|---|
| T+0 | EDR | Sysmon Event ID 1: powershell.exe executes vssadmin delete shadows | Initial indicator |
| T+30s | EDR | Sysmon Event ID 11: Mass file creation with .locked extension | Confirms encryption |
| T+1m | EDR | NetworkConnect: Outbound connection to Tor exit node | Possible ransom payment channel |
| T+2m | Network | DNS query: payment-portal.onion.to | C2 / payment infrastructure |
| T+5m | Cloud | CloudTrail: IAM key created from compromised EC2 instance | Lateral movement to cloud |
| T+10m | Endpoint | FileCreateStreamHash: Ransom note README.txt in 100 folders | Impact confirmation |
Correlation Query (Splunk):
| tstats `summariesonly` count from datamodel=Endpoint.Processes where Processes.process_name=vssadmin.exe by _time, host, user
| join host [
    | tstats `summariesonly` count from datamodel=Endpoint.Filesystem where Filesystem.file_name=*.locked by _time, host
]
| join host [
    | tstats `summariesonly` count from datamodel=Network_Resolution.DNS where DNS.query=*.onion.to by _time, host
]
| stats count by host, user
| where count > 3
| eval alert_type="ransomware_correlation"
XDR: Extended Detection and Response
XDR extends EDR by integrating data from multiple sources into a unified detection and response platform.
| XDR Platform | Integrated Data Sources | Unique Strength |
|---|---|---|
| Microsoft Defender XDR | Endpoint (MDE) + Identity (MDI) + Email (MDO) + Cloud Apps (MDCA) + SIEM (Sentinel) | Native Microsoft ecosystem, unified incident scoring |
| CrowdStrike Falcon XDR | Endpoint + Identity + Cloud + Threat Intelligence | Best threat intel, Falcon Fusion SOAR |
| Palo Alto Cortex XDR | Endpoint + Firewall + Cloud + Threat Intelligence | Network + endpoint correlation, XDR agent + firewall integration |
| Trend Micro Vision One | Endpoint + Email + Network + Cloud + Server | Good breadth, XDR across email and network |
| SentinelOne Vigilance | Endpoint + Cloud + Identity + Network | Autonomous response, Storyline correlation |
XDR vs. SIEM + EDR:
| Aspect | SIEM + Separate EDR | XDR |
|---|---|---|
| Integration | Manual correlation, API integration | Native, built-in correlation |
| Data normalization | Requires custom parsing | Vendor-normalized |
| Detection speed | Depends on SIEM ingestion latency | Typically faster (native pipeline) |
| Response | SOAR playbooks or manual | Integrated response across all vectors |
| Vendor lock-in | Lower (mix and match) | Higher (single vendor ecosystem) |
| Cost | Variable (multiple licenses) | Often bundled, can be efficient |
| Flexibility | Higher (custom rules, any data source) | Lower (vendor-controlled schema and rules) |
💡 Practitioner tip: For Microsoft-heavy organizations (Azure, M365, Windows), Microsoft Defender XDR + Sentinel is the most efficient and integrated option. For heterogeneous environments (Linux, AWS, GCP, diverse endpoints), a best-of-breed approach (CrowdStrike + Splunk/Elastic) provides more flexibility. The key is correlation, if your EDR and SIEM don't talk to each other, you're doing detection in silos.
Alert Management
Figure · Tiers
Maturity levels for monitoring activities
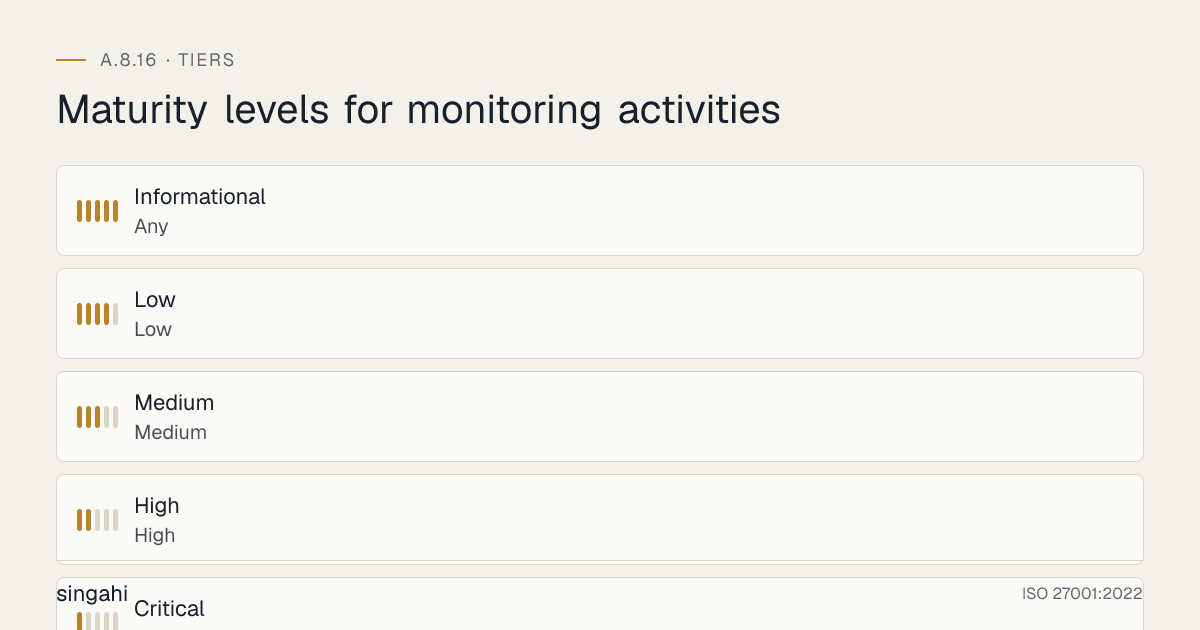
A SIEM without alert management is a noise generator. Alert management is the discipline of turning raw alerts into actionable incidents.
Alert Triage Process
┌─────────────┐    ┌─────────────┐    ┌─────────────┐    ┌─────────────┐
│   ALERT     │ →  │  ENRICHMENT │ →  │  PRIORITIZE │ →  │  DECISION   │
│  (Raw SIEM  │    │  (Add context│    │  (Score risk,│    │  (Investigate│
│   detection) │    │  : user, asset│    │  check SLA) │    │  , escalate,│
│              │    │  , threat intel│    │             │    │  or dismiss)│
└─────────────┘    └─────────────┘    └─────────────┘    └─────────────┘
Alert Enrichment (Automated):
| Enrichment Type | Data Source | Value |
|---|---|---|
| User identity | AD, Azure AD, HR system | Is this a VIP? Is this a terminated employee? |
| Asset criticality | CMDB, asset inventory | Is this a domain controller or a test server? |
| Threat intelligence | MISP, VirusTotal, CrowdStrike | Is this IP/domain/hash known malicious? |
| Geolocation | MaxMind, IPinfo | Where is this IP located? Is it expected? |
| Vulnerability data | Tenable, Qualys | Is this asset vulnerable to the detected technique? |
| Recent incidents | Case management system | Has this user/asset been in an incident before? |
| Peer group baseline | UEBA | Is this activity unusual for this user's role? |
Alert Prioritization Framework
Not all alerts are equal. Use a risk-based prioritization matrix:
| Severity | Asset Criticality | Threat Certainty | Response SLA | Example |
|---|---|---|---|---|
| Critical | Critical (DC, DB, CEO) | Confirmed (IOC match, known malware) | 15 minutes | Ransomware on file server, DCSync detected |
| High | High (Production app, sensitive data) | Likely (behavioral match + anomaly) | 1 hour | Impossible travel + off-hours + bulk data access |
| Medium | Medium (Standard workstation) | Possible (single anomaly) | 4 hours | Failed login from unusual country |
| Low | Low (Test environment, public data) | Unlikely (policy violation only) | 24 hours | USB device inserted on non-sensitive workstation |
| Informational | Any | Context only | No SLA | Baseline deviation within normal range |
Alert Fatigue Reduction
Alert fatigue is the #1 reason SOC analysts miss real threats. The average SOC receives 10,000+ alerts per day. 90% are false positives.
Alert Fatigue Reduction Strategies:
| Strategy | Implementation | Expected Reduction |
|---|---|---|
| Rule tuning | Exclude known benign patterns, refine thresholds | 30–50% |
| Alert suppression | Suppress alerts during maintenance windows, for known service accounts | 10–20% |
| Alert correlation | Group related alerts into single incident (e.g., 100 failed logins = 1 brute force incident) | 40–60% |
| Threshold elevation | Increase thresholds for low-value alerts after 30 days of baseline | 20–30% |
| Risk-based scoring | Only alert on high-risk scores; queue medium/low for batch review | 50–70% |
| ML-based filtering | Use ML to classify alert likelihood as true positive | 20–40% |
| Automated enrichment | Auto-dismiss alerts where enrichment shows benign context | 10–20% |
| Deduplication | Remove duplicate alerts from multiple sensors (e.g., IDS + EDR both detect same malware) | 10–15% |
Alert Correlation Example:
Before correlation:
- 10:00: Failed login from 192.168.1.1 (Alert #1)
- 10:01: Failed login from 192.168.1.1 (Alert #2)
- 10:02: Failed login from 192.168.1.1 (Alert #3)
... (50 alerts)
- 10:15: Successful login from 192.168.1.1 (Alert #51)
- 10:16: Privileged command executed (Alert #52)

After correlation:
- Incident #1: Brute force attack followed by successful compromise (1 incident, 52 correlated alerts)
SOAR, Security Orchestration, Automation, and Response
SOAR automates repetitive SOC tasks.
| SOAR Platform | Key Strength | Best For | Pricing model |
|---|---|---|---|
| Ansible + custom scripts | Fully customizable | Technical teams, specific workflows | Free (labor cost) |
Common SOAR Playbooks:
| Playbook | Trigger | Actions | Time Saved |
|---|---|---|---|
| Phishing response | Email reported as phishing | Extract indicators, check reputation, quarantine similar emails, block sender, create case | 30 min → 2 min |
| Malware containment | EDR detects malware | Isolate endpoint, block hash at firewall, search for hash across environment, create case | 45 min → 3 min |
| Account compromise | Impossible travel alert | Disable account (with approval), force password reset, revoke sessions, notify manager, create case | 30 min → 2 min |
| Alert enrichment | Any high-priority alert | Enrich IP with threat intel, check asset criticality, check user history, attach to case | 10 min → 30 sec |
| False positive feedback | Analyst marks false positive | Update suppression rule, notify detection engineer, track FP rate | 15 min → 0 min |
💡 Practitioner tip: Alert fatigue is the silent killer of security monitoring programs. SOC teams buried in tens of thousands of daily alerts end up spending their time on false positives instead of real threats. If your SOC has more than 100 actionable alerts per analyst per day, you have an alert fatigue problem. The fix is not hiring more analysts, it's tuning your rules. We typically reduce alert volume by 60–80% in the first 30 days of engagement through systematic tuning.
The SOC Operating Model
A Security Operations Center (SOC) is the organizational engine that executes monitoring. Without a defined operating model, even the best tools fail.
SOC Tiers
| Tier | Role | Responsibility | Typical Experience | Escalation Trigger |
|---|---|---|---|---|
| L1, Triage | SOC Analyst | Alert triage, initial enrichment, false positive dismissal, playbook execution | 0–2 years | Confirmed threat, needs investigation beyond playbook |
| L2, Investigation | SOC Analyst / Senior Analyst | Deep investigation, threat hunting, malware analysis, IOC extraction | 2–5 years | APT, insider threat, major incident, needs incident response |
| L3, Expert | Senior Analyst / Threat Hunter | Advanced forensics, detection engineering, threat intel, red team coordination | 5+ years | Nation-state, ransomware, major breach, needs executive briefing |
| L4, Incident Response | IR Lead / CISO | Crisis management, legal coordination, communications, post-incident review | 10+ years | Confirmed breach, data exfiltration, regulatory notification required |
SOC Shift Schedules
| Model | Coverage | Staff Required | Best For | Fatigue Risk |
|---|---|---|---|---|
| 8×5 (Business hours) | Mon–Fri, 9 AM–5 PM | 2–3 analysts | Small orgs, low risk, compliance-only SOC | Low |
| 12×5 (Extended) | Mon–Fri, 7 AM–7 PM | 4–5 analysts | Mid-size, moderate risk | Low |
| 24×5 (Weekday always) | Mon–Fri, 24 hours | 6–8 analysts | Mid-size, after-hours risk | Medium |
| 24×7 (Follow-the-sun) | 24/7 with regional handoffs | 9–12+ analysts | Large orgs, high risk, global operations | Low (if distributed) |
| 24×7 (In-house shifts) | 24/7 with night shifts | 12–15 analysts | Large orgs, single geography | High (burnout risk) |
| 24×7 (Hybrid: in-house + MDR) | Business hours in-house, nights/weekends outsourced | 4–6 in-house + MDR contract | Most growing companies | Low |
| Fully Managed (MDR) | 24/7 by vendor | 0–2 internal | Small orgs, no SOC capability | Low (but dependency risk) |
Shift Handoff Protocol:
Every shift change must include:
- Active incident status (open incidents, severity, current owner)
- Alerts requiring follow-up (triage incomplete, awaiting enrichment)
- System health issues (SIEM lag, agent failures, tool outages)
- Threat intelligence updates (new IOCs, active campaigns)
- Scheduled maintenance or changes (planned downtime, rule deployments)
SOC Runbooks
A runbook is a step-by-step procedure for handling specific alert types.
Runbook Structure:
Template
Runbook: Ransomware Detection
Trigger
EDR alert: Mass file extension changes (Event ID 11: *.locked, *.encrypted)
Initial Response (First 5 minutes)
- Confirm alert: Check if file extensions are actually changed (not just created)
- Identify affected host: Get hostname, IP, user from EDR alert
- Check isolation status: Is host already isolated by EDR auto-response?
- Check for lateral movement: Search SIEM for same user login to other hosts in last 1 hour
Containment (Next 10 minutes)
- Isolate affected host if not already isolated
- Disable affected user account
- Block known malicious IPs/domains at firewall
- Check backup status: Is last backup clean? Can we restore?
Investigation (Next 30 minutes)
- Determine entry vector: Phishing email? RDP? Exploit?
- Identify patient zero: First affected host and timeline
- Check for data exfiltration: Unusual outbound transfers in last 48 hours
- Determine ransomware family: Check extension, note text, IOCs
- Check for persistence: Scheduled tasks, services, registry keys
Eradication & Recovery
- Reimage affected hosts (do not "clean", reimage)
- Restore from clean backup
- Reset passwords for affected user and any admin accounts
- Patch entry vector vulnerability
Post-Incident
- Document timeline
- Update detection rules (new IOCs, new TTPs)
- Brief management
- Schedule lessons learned meeting
Escalation
- Escalate to L3 if: Lateral movement confirmed, domain controller affected, data exfiltration confirmed
- Escalate to L4 if: Regulatory notification required, >10 hosts affected, ransom demand received
Escalation Matrix
| Scenario | L1 Action | L2 Action | L3 Action | L4 Action | Timeline |
|---|---|---|---|---|---|
| Single malware alert | Triage, playbook | Verify, IOC extraction | Detection update | Notification | 1 hour |
| Account compromise | Isolate, disable | Investigation, scope | Threat hunting | If customer data involved | 2 hours |
| Lateral movement | Immediate escalation | Containment, scoping | Full incident lead | Crisis management | 30 minutes |
| Ransomware | Immediate escalation | Containment coordination | Technical lead | Business continuity, legal | 15 minutes |
| Data exfiltration | Immediate escalation | Investigation, quantification | Forensic lead | Regulatory, legal, PR | 1 hour |
| Insider threat | Escalate immediately | Covert investigation | Forensic lead | HR, legal, law enforcement | 2 hours |
SOC Metrics & Staffing Model
Staffing Formula:
Analysts needed = (Alerts per day × Avg time per alert) / (Hours per day × Analyst efficiency)

Example:
- 2,000 alerts/day
- 10 minutes average triage time
- 8 hours/day effective work (accounting for breaks, meetings)
- 70% efficiency (30% of time spent on non-alert work: training, tuning, projects)

Analysts needed = (2,000 × 10) / (480 × 0.70) = 20,000 / 336 = 59 analyst-hours/day = 7.4 → 8 analysts

For 24/7 coverage with 8 analysts: Use hybrid MDR model or accept 8×5 coverage with on-call escalation.
Metrics & KPIs
What gets measured gets managed. Security monitoring metrics must be precise, actionable, and benchmarked.
The Essential Metrics Dashboard
| Metric | Definition | Target | How to Calculate |
|---|---|---|---|
| MTTD (Mean Time to Detect) | Time from attack start to alert generation | < 24 hours | Average of (Alert time – Attack start time) across incidents |
| MTTR (Mean Time to Respond) | Time from alert generation to initial containment | < 1 hour for Critical | Average of (Containment time – Alert time) across incidents |
| MTTC (Mean Time to Contain) | Time from attack start to full containment | < 4 hours for Critical | Average of (Containment time – Attack start time) |
| Alert volume | Total alerts per day | Declining trend (tuning) | Count of alerts in SIEM |
| False positive rate | % of alerts that are false positives | < 5% | (False positives / Total alerts) × 100 |
| Detection coverage | % of MITRE ATT&CK techniques covered by rules | > 70% for Tactics of interest | (Covered techniques / Total techniques in scope) × 100 |
| Detection rule count | Total active detection rules | Growing trend | Count in detection-as-code repo |
| Rule efficacy | % of rules that generated true positives in last 30 days | > 30% | (Rules with TP / Total rules) × 100 |
| SIEM ingestion rate | GB/day or EPS | Within budget, stable | SIEM dashboard or log aggregator metrics |
| Log source coverage | % of critical assets sending logs | 100% | (Assets forwarding logs / Total critical assets) × 100 |
| Log retention compliance | % of log sources meeting retention policy | 100% | Audit storage vs. policy requirements |
| SLA compliance | % of alerts meeting response SLA | > 95% | (Alerts within SLA / Total alerts) × 100 |
| Incident closure rate | % of incidents closed within target time | > 90% | (Closed on time / Total closed) × 100 |
| SOC analyst use | % of analyst time on value-added work | 70–80% | (Time on investigation + hunting + tuning) / Total time |
| Threat hunting hours | Hours per week spent on proactive hunting | > 20% of SOC time | Tracked via timesheet or ticket tagging |
| Mean time to tune | Days from rule deployment to acceptable FP rate | < 14 days | Average of (Tuning complete date – Deployment date) |
| SOAR automation rate | % of alerts handled without human intervention | 30–60% | (Auto-resolved alerts / Total alerts) × 100 |
| Escalation rate | % of alerts escalated to higher tier | < 10% | (Escalated alerts / Total alerts) × 100 |
| Mean time to patch detection gap | Days from new threat emergence to detection rule | < 7 days | Average for new high-priority threats |
Benchmarking Your SOC
| Metric | Underperforming | Average | High-Performing | Elite |
|---|---|---|---|---|
| MTTD | > 7 days | 24–72 hours | 1–12 hours | < 1 hour |
| MTTR | > 4 hours | 1–4 hours | 15–60 minutes | < 15 minutes |
| False positive rate | > 20% | 10–20% | 5–10% | < 5% |
| Alert volume per analyst/day | > 200 | 100–200 | 50–100 | < 50 |
| Detection coverage (ATT&CK) | < 30% | 30–50% | 50–70% | > 70% |
| SOAR automation rate | < 10% | 10–30% | 30–50% | > 50% |
| Mean time to patch gap | > 30 days | 14–30 days | 7–14 days | < 7 days |
SIEM Performance Metrics
| Metric | What It Means | Target | Action if Failing |
|---|---|---|---|
| Ingestion latency | Time from log generation to SIEM availability | < 5 minutes | Check network, collector health, parsing complexity |
| Query response time | Time for SIEM search to return results | < 30 seconds for 24h | Add indexing, optimize queries, scale infrastructure |
| Indexer lag | Time between real-time and indexed data | < 1 minute | Scale indexers, check resource constraints |
| Forwarder health | % of log forwarders reporting healthy | 100% | Monitor forwarder status, auto-restart failed agents |
| Disk use | % of storage used | < 80% | Archive old data, add storage, reduce retention |
| License use | % of SIEM license used | < 85% (headroom) | Filter noise, optimize ingestion, renegotiate license |
| Search head concurrency | Number of simultaneous searches | Within capacity | Add search heads, optimize scheduled searches |
Tool Comparison
Complete SIEM / Security Monitoring Matrix
| Tool | Type | Deployment | Best For | SIEM | UEBA | SOAR | EDR Integration | Cloud Native | Open Source |
|---|---|---|---|---|---|---|---|---|---|
| Wazuh | SIEM/XDR | Self-managed | Budget-conscious, compliance | ✅ | ⚠️ | ⚠️ | ✅ (agent) | ⚠️ | ✅ |
| Arkime | PCAP/NDR | Self-managed | Full packet capture, forensics | ❌ | ❌ | ❌ | ⚠️ | ⚠️ | ✅ |
| Zeek | NSM/NDR | Self-managed | Network analysis, protocol detection | ❌ | ❌ | ❌ | ⚠️ | ⚠️ | ✅ |
| Suricata | IDS/IPS | Self-managed | Network intrusion detection | ❌ | ❌ | ❌ | ⚠️ | ⚠️ | ✅ |
| Falco | Container Runtime | Self-managed | Container security, K8s runtime | ❌ | ❌ | ⚠️ | ⚠️ | ✅ (K8s) | ✅ |
Open Source Stack for Budget-Conscious Organizations
If budget is constrained, this open-source stack provides 80% of enterprise capability at 10% of the cost:
| Layer | Tool | Role |
|---|---|---|
| Log collection | Fluent Bit + Filebeat | Lightweight log shippers |
| Log aggregation | Kafka or syslog-ng | Buffering and routing |
| SIEM | Elastic Security (self-managed) | Core SIEM, detection, cases |
| Endpoint monitoring | Wazuh + Sysmon | EDR-like capability, FIM, rootkit detection |
| Network monitoring | Suricata + Zeek | IDS + network analysis |
| Container monitoring | Falco + K8s audit | Container runtime security |
| Threat hunting | Jupyter + Python + Elastic | Custom hunting notebooks |
| Vulnerability | OpenVAS + Wazuh | Vulnerability scanning |
| Case management | TheHive + Cortex | Case management + IOC analysis |
| Automation | Shuffle or custom scripts | SOAR-lite |
Trade-offs:
- No vendor support (community support only)
- Requires internal expertise
- Higher time-to-value
- Less polished UX
- Integration between tools requires manual work
Implementation Roadmap: 8 Weeks
Figure · Timeline
Escalation timeline
- Day 1Inventory all critical assets
- Day 2Map existing log sources
- Day 3Define monitoring policy
- Day 4Select SIEM/tooling
- Day 5Design architecture
- 6–7Deploy basic log collection
Week 1: Assessment & Planning
| Day | Activity | Deliverable | Owner |
|---|---|---|---|
| 1 | Inventory all critical assets (servers, apps, DBs, network devices, cloud) | Asset inventory with criticality ratings | IT Manager |
| 2 | Map existing log sources (what's already logging, what's missing) | Log source gap analysis | Security Analyst |
| 3 | Define monitoring policy (scope, retention, review frequency, privacy) | Draft monitoring policy | CISO |
| 4 | Select SIEM/tooling (based on budget, org size, tech stack) | Tool selection matrix with recommendation | CISO + Procurement |
| 5 | Design architecture (collectors, forwarders, network diagram) | Architecture diagram | Security Engineer |
| 6–7 | Deploy basic log collection (syslog server, Windows Event Forwarding) | Central log collector operational | Security Engineer |
Week 2: Core Infrastructure
| Day | Activity | Deliverable |
|---|---|---|
| 8–9 | Deploy SIEM (install, license, basic configuration) | SIEM accessible, ready for ingestion |
| 10–11 | Configure critical log sources (firewall, AD, key servers) | 5+ log sources forwarding to SIEM |
| 12 | Implement time synchronization (NTP across all sources) | NTP configured, drift < 1 second |
| 13 | Configure log parsing and normalization (ECS or CIM) | 3+ log sources normalized |
| 14 | Test log flow end-to-end (source → collector → SIEM) | Validation report |
Week 3: Detection Rules
| Day | Activity | Deliverable |
|---|---|---|
| 15–16 | Deploy top 10 detection rules (failed logins, privilege escalation, malware) | 10 rules active, tested |
| 17–18 | Configure basic alerting (email, Slack, PagerDuty) | Alert channel operational |
| 19 | Test detections with known bad events (simulate failed logins, test account) | Detection test report |
| 20 | Configure log retention and archiving (hot/warm/cold tiers) | Retention policy implemented |
| 21 | Document runbooks for top 5 alert types | 5 runbooks published |
Week 4: Cloud & Advanced Sources
| Day | Activity | Deliverable |
|---|---|---|
| 22–23 | Enable cloud audit logs (CloudTrail, Azure Monitor, GCP audit) | Cloud logs flowing to SIEM |
| 24 | Deploy endpoint monitoring (EDR or Wazuh) | 80% of endpoints reporting |
| 25 | Configure database audit logs (top 3 critical databases) | DB audit enabled, forwarded |
| 26 | Enable network flow monitoring (NetFlow, VPC Flow Logs) | Flow data visible in SIEM |
| 27–28 | Configure K8s audit logs and container runtime (if applicable) | Container monitoring active |
Week 5: Alert Management & Triage
| Day | Activity | Deliverable |
|---|---|---|
| 29–30 | Implement alert enrichment (threat intel, asset criticality) | Enrichment pipeline active |
| 31–32 | Deploy SOAR playbooks (phishing, malware, account compromise) | 3 playbooks automated |
| 33 | Configure alert suppression and deduplication | 20% alert volume reduction |
| 34 | Establish SOC shift schedule and handoff protocol | Schedule published, training complete |
| 35–36 | Conduct SOC training (tool usage, runbooks, escalation) | All analysts trained |
Week 6: UEBA & Behavioral Analytics
| Day | Activity | Deliverable |
|---|---|---|
| 37–38 | Deploy UEBA (built-in SIEM UEBA or standalone tool) | UEBA baseline learning started |
| 39–40 | Configure behavioral baselines (login times, data access, geolocation) | Baselines established for 50% of users |
| 41 | Implement risk scoring model | Risk scores visible in SIEM |
| 42 | Test UEBA with simulated anomaly (impossible travel test) | UEBA detection confirmed |
Week 7: Detection Engineering & Tuning
| Day | Activity | Deliverable |
|---|---|---|
| 43–44 | Expand detection rules to 50 (cover top 20 ATT&CK techniques) | 50 rules active |
| 45 | Map rules to MITRE ATT&CK | ATT&CK coverage matrix published |
| 46–47 | Tune false positives (target < 10% FP rate) | Tuning report, FP rate measured |
| 48 | Implement detection-as-code repository (Git + CI/CD) | Detection repo operational |
Week 8: Metrics, Audit Readiness & Handoff
| Day | Activity | Deliverable |
|---|---|---|
| 49–50 | Build metrics dashboard (MTTD, MTTR, alert volume, coverage) | Dashboard live |
| 51 | Conduct internal audit (review logs, test alerts, verify retention) | Internal audit report |
| 52 | Document evidence for ISO 27001 audit (policy, procedures, records) | Evidence package ready |
| 53–54 | Final tuning and optimization (SIEM performance, query speed) | Performance report |
| 55–56 | Project handoff and operational transition (SOC takes ownership) | Handoff document signed |
Week 8 Milestone: ISO 27001 A.8.16 Audit Ready
| Audit Requirement | Evidence |
|---|---|
| Monitoring policy | Approved, published, communicated |
| Log source coverage | 100% of critical assets confirmed |
| Centralized collection | SIEM dashboard showing live ingestion |
| Detection rules | 50+ rules mapped to risk register |
| Alert review records | 2 weeks of documented alert triage |
| Anomaly response | Runbooks with escalation procedures |
| Retention compliance | 90-day hot, 1-year warm, 3-year cold |
| Clock synchronization | NTP configured, drift verified |
| Metrics | Dashboard showing MTTD, MTTR, coverage |
Common Audit Failures & Fixes
After guiding 50+ companies through ISO 27001 audits, we've seen the same A.8.16 non-conformities repeatedly. Here's how to avoid them.
Failure 1: No Centralized Log Collection
Auditor finding: "Logs are stored only on local systems. There is no evidence of centralized collection or review."
Why it happens: Organizations enable logging on each server but never configure forwarding. They think "we have logs" means "we are compliant."
The fix:
- Deploy a syslog collector (rsyslog, syslog-ng, or Splunk UF) within 2 weeks
- Forward all critical Windows events via WEF or Winlogbeat
- Forward all Linux auth logs via rsyslog
- Verify collection daily: create a dashboard showing log source health
- Document the architecture in the monitoring policy
Evidence for audit: SIEM dashboard showing active log sources, network diagram of log flow, policy section on collection.
Failure 2: Logs Are Not Reviewed
Auditor finding: "Logs are collected but there is no evidence of regular review or analysis for security events."
Why it happens: The SIEM is a "set and forget" tool. Alerts fire into email but no one has time to review them.
The fix:
- Define review frequency: real-time alerts for critical events, daily triage for high/medium, weekly trend analysis
- Assign specific people to review (named in policy, not "the IT team")
- Document every review: date, reviewer, scope, findings, actions taken
- Start with just 30 minutes per day. Review yesterday's authentication failures and privilege changes.
- Use SOAR to auto-dismiss obvious false positives, reducing review burden
Evidence for audit: Log review logs, daily triage tickets, weekly summary reports, incident records created from log reviews.
Failure 3: No Alerting on Critical Events
Auditor finding: "The organization collects logs but has no automated alerting configured for anomalous behavior."
Why it happens: Organizations confuse log collection with monitoring. Monitoring requires detection and response.
The fix:
- Define 10 critical events that must generate alerts (see Section 8)
- Configure these alerts in your SIEM within 1 week
- Ensure alerts go to someone who is accountable (not a group mailbox that no one owns)
- Test each alert monthly: simulate the event, verify the alert fires
- Document alert configuration and response procedures
Evidence for audit: Screenshot of alert configuration, test records, incident tickets created from alerts.
Failure 4: Insufficient Log Retention
Auditor finding: "Logs are retained for 30 days, but the policy requires 90 days, and regulatory requirements mandate 1 year."
Why it happens: Default settings are accepted. Disk space is expensive. No one checks retention against policy.
The fix:
- Define retention periods by log type and regulation:
- Authentication logs: 1 year
- Firewall logs: 90 days hot, 1 year warm
- Application logs: 90 days
- Cloud audit logs: 1 year (AWS CloudTrail default)
- Implement hot/warm/cold tiering: recent data in fast storage, old data in cheap archive
- Automate archival: S3 Glacier, Azure Archive, or tape backup
- Verify retention quarterly: restore a random archive log and confirm readability
- Document retention policy and technical implementation
Evidence for audit: Retention policy, storage configuration, sample archived log, quarterly verification records.
Failure 5: Clock Synchronization Issues
Auditor finding: "System clocks are not synchronized. Log timestamps vary by more than 5 minutes across systems, making correlation impossible."
Why it happens: NTP is not configured on all devices, or devices are using different NTP servers with drift.
The fix:
- Deploy central internal NTP servers that sync to NIC or NPL time servers (samay1.nic.in, samay2.nic.in, time.nplindia.org), as the CERT-In Directions require
- Configure all Windows systems to sync with domain controllers (which sync to NTP)
- Configure all Linux systems with
chronydorntpdpointing to central NTP - Configure network devices, firewalls, and appliances to sync to NTP
- Verify daily: run a script that checks time drift across all systems
- Set alarm if drift > 1 second
Evidence for audit: NTP configuration files, time drift check results, SIEM query showing consistent timestamps.
Failure 6: No Monitoring of Cloud Infrastructure
Auditor finding: "The organization operates workloads in AWS but the monitoring policy and SIEM do not cover cloud events."
Why it happens: Cloud monitoring requires different tools and expertise. On-prem teams don't extend their scope to cloud.
The fix:
- Enable CloudTrail (AWS), Activity Log (Azure), or Cloud Audit Logs (GCP) in all regions
- Forward cloud audit logs to your SIEM using native connectors or Event Hub/Kinesis
- Configure alerts for cloud-specific events: IAM changes, public resource creation, root account use
- Include cloud in monitoring policy scope
- Assign cloud security monitoring responsibility to a named person
Evidence for audit: CloudTrail configuration screenshot, SIEM showing cloud events, policy section on cloud monitoring.
Failure 7: Privileged User Activity Not Monitored
Auditor finding: "There is no specific monitoring or alerting for administrator and privileged user activities."
Why it happens: Administrators are trusted, so their activity is not scrutinized. Or, admins object to being monitored.
The fix:
- Log all privileged actions: sudo usage, admin group membership changes, IAM policy changes
- Alert on privileged actions: create a dedicated alert channel for admin activity
- Review admin activity weekly: separate review from standard user activity
- Implement break-glass procedures: emergency admin access requires manager approval and is fully logged
- No admin should be able to clear or modify their own logs
Evidence for audit: Privileged user monitoring dashboard, weekly admin review records, break-glass procedure.
Failure 8: Monitoring Policy Does Not Exist
Auditor finding: "There is no documented policy or procedure for monitoring activities."
Why it happens: Organizations focus on tools and forget governance. "We have Splunk" is not a policy.
The fix:
- Write a monitoring policy (see Section 2 for minimum requirements)
- Get it approved by management (CISO or CEO depending on org size)
- Publish it on the intranet or document management system
- Communicate it to all relevant personnel (IT, security, operations)
- Review annually and after significant changes
Evidence for audit: Signed policy document, communication records, acknowledgment tracking, review records.
Failure 9: No Response Procedure for Anomalies
Auditor finding: "Anomalies are detected but there is no defined procedure for evaluating or escalating potential incidents."
Why it happens: Alerts fire but no one knows what to do. The link between monitoring and incident response is broken.
The fix:
- Define anomaly severity levels (Critical, High, Medium, Low)
- Map each severity to a response action:
- Critical: Immediate SOC investigation, potential incident escalation
- High: SOC investigation within 1 hour
- Medium: Daily batch review
- Low: Weekly trend review
- Document escalation to incident response (A.5.24)
- Create runbooks for top 5 anomaly types (see Section 17)
- Test the escalation path quarterly: simulate an anomaly, verify IR is engaged
Evidence for audit: Anomaly response procedure, runbooks, escalation test records, incident tickets created from anomalies.
Failure 10: Third-Party Access Not Monitored
Auditor finding: "Vendor and contractor access to systems is not subject to the same monitoring as employee access."
Why it happens: Third-party accounts are created but not included in monitoring scope. Vendor VPNs are separate from corporate VPN.
The fix:
- Include all third-party accounts in identity monitoring (same as employees)
- Log and alert on all vendor access: VPN, RDP, cloud console, application access
- Review vendor access weekly or monthly
- Implement time-bound access: vendor accounts expire automatically
- Require vendors to provide their own audit logs for critical systems
Evidence for audit: Vendor access logs, vendor monitoring dashboard, third-party access review records.
Illustrative Scenarios: Breaches That Monitoring Could Have Prevented
Illustrative scenario, a composite example for guidance, not a specific Singahi engagement or a verified outcome.
What happened:
- Attackers compromised an HVAC vendor's credentials (Fazio Mechanical)
- Used vendor access to enter Target's network
- Moved laterally to the POS system
- Installed malware on POS terminals
- Exfiltrated 40 million credit card numbers and 70 million customer records
Monitoring failures:
- Target had a SIEM (FireEye) but did not monitor vendor access adequately
- The SIEM generated alerts for the malware installation, but alerts were not reviewed or acted upon
- Lateral movement (HVAC network → POS network) was not segmented or monitored
- Data exfiltration over weeks went undetected
What proper monitoring would have caught:
- Vendor access alert: "Vendor account logged in at 2 AM, accessed file server, then POS network"
- Malware detection: FireEye alert (which did fire) escalated to immediate response
- Lateral movement: "Connection from HVAC VLAN to POS VLAN detected"
- Data exfiltration: "Unusual outbound FTP connection from POS server"
Lesson: A SIEM without alert review and response is just expensive storage. The FireEye alert fired. No one acted.
Illustrative Scenario 2: Equifax (2017), The 147 Million Record Breach
What happened:
- Apache Struts vulnerability (CVE-2017-5638) was exploited
- Attackers gained access to Equifax's dispute portal
- Moved laterally through the network
- Accessed databases containing personal data
- Exfiltrated data over 76 days
Monitoring failures:
- Vulnerability scanning (A.8.8) failed to identify the Apache Struts vulnerability promptly
- Network monitoring did not detect the initial exploitation or lateral movement
- Database monitoring did not detect unauthorized database queries
- Data exfiltration went unnoticed for 76 days
- SSL certificate monitoring failed: Equifax discovered the breach only when they renewed an SSL certificate and noticed anomalous traffic
What proper monitoring would have caught:
- Web application monitoring: "Apache Struts exploitation attempt detected by WAF"
- Network monitoring: "Unusual connection from web server to database server"
- Database monitoring: "Database queries from web server IP returning 147M records"
- Data exfiltration: "76-day sustained outbound transfer of 30GB+ to unknown IP"
- Certificate monitoring: This should not have been the detection mechanism
Lesson: Monitoring must be layered. Relying on a single point of failure (SSL certificate renewal) for breach detection is negligence. Network + application + database monitoring would have caught this at multiple stages.
Illustrative Scenario 3: SolarWinds / Sunburst (2020), The Supply Chain Breach
What happened:
- Attackers compromised SolarWinds' build system
- Inserted malicious code into Orion software updates
- 18,000 organizations downloaded the backdoored update
- Attackers used the backdoor to access select high-value targets (including government agencies)
- Activity went undetected for months
Monitoring failures:
- Organizations that did not monitor outbound DNS from their Orion servers missed the C2 beaconing
- UEBA was missing: The Orion server making outbound HTTPS to unknown domains was anomalous
- Supply chain monitoring: No one monitored the integrity of the software update itself
- Cloud monitoring: Attackers accessed Azure AD and Office 365, which was not monitored for anomalous application access
What proper monitoring would have caught:
- DNS monitoring: "Orion server querying avsvmcloud.com [DGA-like domain] every 60 seconds"
- UEBA: "SolarWinds server making HTTPS to unknown domain, never seen before"
- Cloud monitoring: "Application 'SolarWinds Orion' accessing Azure AD with unusual permissions"
- Network monitoring: "Beaconing pattern detected: 60-second intervals to same external IP"
Lesson: Supply chain attacks require monitoring the vendor's behavior within your environment. The software was trusted, but its behavior was anomalous. DNS and behavioral monitoring catch supply chain compromises when signature-based tools cannot.
Illustrative Scenario 4: Colonial Pipeline (2021), Ransomware and Operational Shutdown
What happened:
- Attackers compromised Colonial Pipeline via a leaked VPN password
- Used the VPN to access the business network
- Deployed DarkSide ransomware
- Colonial shut down the pipeline (operational network) as a precaution
- Caused fuel shortages across the US East Coast
Monitoring failures:
- VPN monitoring: No alert for VPN login from unusual location or with old password
- Credential monitoring: The VPN password was discovered in a breach database (no credential monitoring)
- OT/ICS monitoring: Separation between IT and OT was assumed but not monitored
- Ransomware indicators: No detection of ransomware precursor activities (AD reconnaissance, lateral movement, backup deletion)
What proper monitoring would have caught:
- VPN monitoring: "VPN login from unexpected geography using old password"
- Credential monitoring: "Password for VPN account found in Have I Been Pwned breach database"
- Network monitoring: "Connection from IT network to OT network detected"
- Endpoint monitoring: "DarkSide ransomware behavior: vssadmin delete shadows, mass file encryption"
Lesson: OT/ICS monitoring is critical. The pipeline was shut down not because ransomware hit the OT network, but because Colonial could not confirm that the OT network was safe. Monitoring the IT/OT boundary would have provided that confidence.
Illustrative Scenario 5: Uber (2016), The Cover-Up
What happened:
- Attackers accessed Uber's GitHub repository and found AWS access keys
- Used keys to access Uber's AWS S3 buckets
- Downloaded 57 million user and driver records
- Disclosure was delayed for over a year
Monitoring failures:
- Cloud monitoring: No alert for AWS access key usage from unknown IP or for bulk S3 downloads
- Code repository monitoring: No monitoring of GitHub for exposed credentials (secrets scanning)
- Data access monitoring: No alert for 57 million record download from S3
- Third-party monitoring: GitHub is a third-party SaaS; Uber did not monitor it for security
What proper monitoring would have caught:
- Cloud monitoring: "AWS access key used from unknown IP address"
- Cloud monitoring: "S3 bulk download: 57M objects accessed from single session"
- Secrets monitoring: "AWS access key committed to GitHub repository"
- Data monitoring: "Unusual data access pattern: entire user database downloaded"
Lesson: Cloud-native monitoring is essential. AWS CloudTrail would have recorded every API call. The data was there, Uber was not watching it. Additionally, secrets scanning in CI/CD (A.8.30) is a prerequisite to monitoring, don't commit credentials to repositories.
Multi-Framework Mapping
A.8.16 is not an island. Mapping it to other frameworks ensures compliance efficiency and audit readiness.
Annex A 8.16 Across Major Frameworks
| Framework | Control Reference | Equivalent Requirement | Key Difference |
|---|---|---|---|
| ISO 27001:2022 | A.8.16 | Monitor networks, systems, and applications for anomalous behavior | Broadest scope; includes "appropriate actions" |
| ISO 27001:2013 | None (new control in 2022) | Logging was A.12.4.1–A.12.4.3, now A.8.15 | A.8.16 adds active monitoring and response |
| SOC 2 (TSC 2017) | CC7.2 | System monitoring | Requires monitoring of system components; less prescriptive on tools |
| PCI DSS v4.0.1 | Req 10.4.1–10.4.1.1 (automated log review), 10.7 (failures of security controls detected), 11.5.1 (IDS/IPS), 11.5.2 (change detection) | Logging and monitoring | Focuses on CHD environment; requires specific log review (daily for critical systems) |
| NIST SP 800-53 Rev 5 | SI-4 (System monitoring), AU-6, IR-4 | Audit review, audit generation, incident handling | Technical depth; requires automated tools for high-impact systems |
| NIST CSF 2.0 | DE.CM-01, DE.CM-03, DE.CM-09, DE.AE-02, DE.AE-03, DE.AE-06 | Anomaly detection, event detection, log analysis | Outcome-focused; doesn't specify tools |
| DORA (EU) | Art. 10 (detection), Arts 17–19 (incident management and reporting) | ICT risk management, incident reporting | Requires continuous monitoring for financial entities; mandatory reporting |
| COBIT 2019 | DSS05.07, APO12.06 | Monitor and review security controls | Governance-focused; links to risk management |
| ITIL 4 | Practice: Information Security | Security monitoring as part of service management | Service-focused, less technical |
| CIS Controls v8 | Controls 8, 13, 16 | Audit logging, network monitoring, application logging | Prescriptive technical controls; specific implementation guidance |
| GDPR (EU) | Art. 32, Art. 33 | Security of processing, breach notification | Monitoring must support breach detection and notification within 72 hours |
| HIPAA (US) | 164.312(b) | Audit controls | Must record and examine access to ePHI; requires regular review |
Mapping: ISO 27001 A.8.16 → SOC 2 CC7.2
| ISO 27001 A.8.16 Component | SOC 2 CC7.2 (points of focus, paraphrased) | Evidence Needed |
|---|---|---|
| Monitoring strategy and scope | Infrastructure and software are monitored | Monitoring policy, scope documentation |
| Log collection and centralisation | Detection tools and data sources are implemented | SIEM configuration, log source inventory |
| Anomaly detection against a baseline | Anomalies are identified and analysed | Detection rules, baseline, alert configuration |
| Analysis and triage | Events are evaluated to determine if they are security events (CC7.3) | Triage records |
| Response to anomalies | Incidents are responded to (CC7.4) | Incident tickets, escalation records |
| Retention | Monitoring records kept for defined periods | Retention policy, storage configuration |
Mapping: ISO 27001 A.8.16 → PCI DSS v4.0.1
| PCI DSS v4.0.1 Requirement | A.8.16 Implementation | Additional PCI Requirements |
|---|---|---|
| Req 10.1: Audit trails | Enable logging on all CHD systems | Must cover all user actions, including privileged users |
| Req 10.2: Audit trail content | Configure detailed OS, application, database logs | Must include user ID, event type, date/time, success/failure, event origin |
| Req 10.3: Clock sync | NTP on all CHD systems | Synchronization must be accurate within 1 minute |
| Req 10.4: Log accessibility | Centralized collection with tamper protection | Logs must be immediately available and unmodifiable |
| Req 10.5: Log review | Daily review of critical logs, weekly for others | Documented review with evidence |
| Req 10.6: Time synchronization | Same as A.8.17 | Time must be consistent across all systems |
| Req 10.7: Retention | 1 year hot, 3 months immediately available | Specific retention requirements for CHD |
Mapping: ISO 27001 A.8.16 → NIST SP 800-53 Rev 5
| NIST Control | Title | A.8.16 Mapping | Implementation Guidance |
|---|---|---|---|
| AU-6 | Audit Record Review | Anomaly detection and log review | Automated review tools + manual review |
| AU-12 | Audit Record Generation | Log source configuration | All security-relevant events must be logged |
| AU-13 | Monitoring for Information Disclosure | Data exfiltration detection | DLP integration, network monitoring |
| IR-4 | Incident Handling | Response to anomalies | SOC runbooks, escalation procedures |
| IR-5 | Incident Monitoring | SOC operations | Continuous monitoring of incident status |
| SI-4 | Information System Monitoring | Network and system monitoring | IDS, SIEM, network behavior analysis |
| SI-4(1) | System Monitoring, Intrusion Detection | IDS/IPS deployment | Automated real-time intrusion detection |
| SI-4(2) | System Monitoring, Automated Alerts | Alert configuration | Automated alerts for critical events |
| SI-4(4) | System Monitoring, Inbound/Outbound Traffic | Network monitoring | Monitor both inbound and outbound traffic |
| SI-4(5) | System Monitoring, System-Generated Alerts | System-level alerting | OS-level alerts, not just network |
| SI-4(7) | System Monitoring, Automated Response | SOAR / automated response | Automated containment actions |
Mapping: ISO 27001 A.8.16 → DORA (EU Digital Operational Resilience Act)
| DORA Article | Requirement | A.8.16 Implementation |
|---|---|---|
| Art. 10(2) | Continuous monitoring of ICT systems | 24/7 monitoring for critical systems |
| Art. 10(3) | Anomaly detection | UEBA, behavioral analytics, ML-based detection |
| Art. 11(1) | Incident detection and reporting | SOC with defined detection and escalation procedures |
| Art. 11(2) | Incident classification | Severity levels mapped to response SLAs |
| Art. 11(3) | Major incident reporting | Automated reporting to regulators within 4 hours |
| Art. 12(1) | Digital operational resilience testing | Red team exercises, alert testing, SOC drills |
FAQ
Q1: Do I need a SIEM to pass an ISO 27001 audit for A.8.16?
No, but you need centralized monitoring and anomaly detection. A SIEM is the most common and effective way to achieve this. For small organizations, a centralized syslog server with daily manual review and basic alerting may be sufficient. However, as you scale, a SIEM becomes essential. The auditor will check: Are you monitoring? Are you detecting anomalies? Are you responding? A SIEM makes this easier but is not strictly mandatory.
Q2: What's the minimum budget for A.8.16 compliance?
For a small organization (under 50 employees), the minimum budget is:
For mid-market (50–500 employees):
For enterprise (500+ employees):
Q3: How do I monitor cloud-native services (serverless, managed databases)?
Cloud-native services are monitored via the cloud provider's APIs:
- Serverless (Lambda, Azure Functions, Cloud Functions): Enable function-level logging (CloudWatch Logs, Azure Monitor, Cloud Logging). Log every invocation, error, and cold start. Forward to SIEM.
- Managed databases (RDS, Azure SQL, Cloud Spanner): Enable native audit logs (RDS audit, Azure SQL Auditing, Cloud Audit Logs). These are API-accessible and forwardable to SIEM.
- Managed Kubernetes (EKS, AKS, GKE): Enable control plane logging (API server, audit, authenticator). Forward via Fluent Bit or cloud-native export.
- API Gateways: Enable access logging and execution logging. Forward to SIEM or cloud monitoring.
The key is to not treat cloud services as "black boxes." Every cloud service has logs. You just need to enable them and forward them.
Q4: What retention period is required for logs?
ISO 27001 does not specify a fixed retention period. It depends on:
- Your monitoring policy (which you define)
- Regulatory requirements (PCI DSS: 1 year, GDPR: as long as necessary for security)
- Legal requirements (litigation hold may require longer retention)
- Industry standards (financial services often require 3–7 years)
Practitioner recommendation:
- Authentication logs: 1 year
- Security event logs: 1 year
- Application logs: 90 days
- Network flow logs: 90 days
- Full packet capture: 7–30 days (unless incident-related)
- Cloud audit logs: 1 year (or as required by cloud provider)
- Archive logs: 3–7 years in cold storage
Q5: How do I handle privacy concerns with user monitoring?
Monitoring user activity must balance security with privacy:
- Document monitoring in your acceptable use policy and privacy policy
- In EU, consult works council if applicable
- Monitor access patterns, not content where possible (e.g., "accessed 500 files" not "read confidential merger memo")
- Avoid keystroke logging or screen recording without explicit consent
- Implement data minimization: only collect what is necessary for security
- Set retention limits: delete user activity baselines when the user departs
- Allow access to one's own logs for transparency (where legally required)
Q6: What's the difference between A.8.15 (Logging) and A.8.16 (Monitoring)?
- A.8.15, Logging: The generation and protection of logs. Ensures logs exist, are accurate, and are protected from tampering. Technical control.
- A.8.16, Monitoring: The analysis of logs and systems for anomalous behavior. Requires detection, review, and response. Operational control.
You need both. A.8.15 without A.8.16 means you have logs but no one looks at them. A.8.16 without A.8.15 means you want to monitor but have no logs to analyze.
Q7: How do I detect zero-day attacks?
Zero-day attacks cannot be detected by signatures (no one knows the signature yet). Detection relies on:
- Behavioral monitoring: Anomalous process execution, unusual network connections, unexpected file changes (EDR, UEBA)
- Network anomaly detection: Beaconing, unusual data flows, DGA domains (NDR, network monitoring)
- Threat hunting: Proactive searches for indicators of unknown threats (e.g., "show me all processes that made outbound connections and were not seen in the last 30 days")
- ML-based anomaly detection: UEBA and network behavior analytics that detect deviations from baseline
- Honeypots / deception: Fake assets that attract attackers; any interaction is anomalous
Q8: Should I build an in-house SOC or use an MDR?
| Factor | In-House SOC | MDR (Managed Detection and Response) |
|---|---|---|
| Cost | High (salaries, tools, training) | Predictable monthly fee |
| Control | Full control over tools and processes | Vendor-controlled, limited customization |
| Expertise | Build over time, harder to hire | Immediate access to experienced analysts |
| Scalability | Requires hiring and training | Scales with contract |
| 24/7 coverage | expensive to staff nights/weekends | Included in MDR service |
| Customization | Fully customizable | Limited to vendor's capabilities |
| Context | Deep knowledge of your environment | Less context, requires knowledge transfer |
| Best for | Large orgs, regulated industries, unique environments | Small-mid orgs, no SOC expertise, budget-constrained |
Practitioner recommendation:
- Under 250 employees: MDR (fully managed)
- 250–1,000 employees: Hybrid (in-house business hours + MDR for nights/weekends)
- 1,000+ employees: In-house SOC with MDR for overflow or specific functions (e.g., threat hunting)
Q9: How do I measure the effectiveness of my monitoring program?
Use the metrics from Section 18. The top 5 metrics are:
- MTTD (Mean Time to Detect): Are you finding threats faster? Target < 24 hours.
- MTTR (Mean Time to Respond): Are you responding faster? Target < 1 hour for critical.
- False positive rate: Are you wasting analyst time? Target < 5%.
- Detection coverage: Are you covered against the threats you care about? Target > 70% of ATT&CK techniques in scope.
- Alert volume per analyst: Is your SOC sustainable? Target < 100 actionable alerts per analyst per day.
Q10: What should I do if my SIEM is too expensive?
Options:
- Reduce ingestion: Filter noise, sample high-volume logs, drop debug logs
- Optimize storage: Use hot/warm/cold tiers; move old data to cheap archive
- Switch to open source: Elastic (self-managed) or Wazuh for core SIEM capability
- Use cloud-native SIEM: Sentinel or Chronicle can be efficient for cloud-first orgs
- Hybrid approach: Use cloud SIEM for real-time alerting and data lake (S3, BigQuery) for long-term storage and batch analysis
- Renegotiate: Many vendors offer significant discounts if you commit to volume tiers or multi-year contracts
Q11: How do I monitor third-party SaaS applications (Slack, Salesforce, GitHub)?
Most SaaS applications provide audit logs via API:
- Slack: Audit logs (Enterprise Grid) via API
- Salesforce: Event Monitoring, Setup Audit Trail
- GitHub: Audit log, Security tab, Dependabot alerts
- Google Workspace: Admin console audit, Google Cloud Identity logs
- Office 365: Unified Audit Log (via Compliance Center or Sentinel connector)
- Jira/Confluence: Audit log (Data Center/Cloud)
- Zoom: Account activity, operation log
Collect these via API connectors (Splunk Add-on, Sentinel Data Connector, Elastic Agent) or custom scripts. Include SaaS in your monitoring policy scope.
Q12: Can I use my existing observability tool (Datadog, New Relic) for security monitoring?
Yes, with caveats:
- Pros: Unified platform, existing infrastructure, cost efficiency, cloud-native
- Cons: Security features are newer and less mature than dedicated SIEMs; limited SOAR, limited detection rule libraries, less strong case management
Best approach:
- Use observability for application security (API abuse, injection, performance-based anomalies)
- Use dedicated SIEM for enterprise security monitoring (correlation, threat hunting, compliance)
- Integrate both: forward observability security findings to SIEM for unified incident management
Q13: What is the most common mistake in A.8.16 implementation?
The most common mistake is deploying tools without process. Organizations buy Splunk, deploy agents, and consider the job done. They don't have:
- A monitoring policy
- Defined review procedures
- Alert tuning and false positive management
- Escalation to incident response
- Metrics and KPIs
The tool is not the control. The process is the control.
Q14: How often should detection rules be updated?
| Rule Type | Update Frequency | Trigger |
|---|---|---|
| IOC-based rules (hashes, IPs, domains) | Daily / Weekly | New threat intelligence feeds |
| Behavioral rules (UEBA, baselines) | Monthly | Baseline drift, seasonal changes |
| TTP-based rules (ATT&CK techniques) | Quarterly | New ATT&CK versions, new attack research |
| Compliance rules | Annually | Policy changes, audit findings |
| Red team feedback | After each exercise | New red team TTPs, evasion techniques |
Q15: Do I need to monitor OT/ICS environments for ISO 27001?
If your scope includes OT/ICS (manufacturing, energy, critical infrastructure), then yes. However, OT monitoring requires specialized tools and approaches:
- Passive monitoring (no active scanning that could disrupt operations)
- Protocol-aware (Modbus, DNP3, IEC 61850)
- Air-gap considerations (data diode for log export)
- Tools: Nozomi Networks, Claroty, Dragos, Fortinet OT Security
If your scope is purely IT, OT may be excluded with explicit scope definition and risk acceptance.
Indian Regulatory Context and Illustrative Scenario for A.8.16
Indian regulators expect security monitoring to be continuous, actionable and aligned with sectoral reporting obligations. RBI's Cyber Security Framework (2016) expects banks to monitor continuously through a security operations centre and to report cyber incidents to RBI quickly (typically within 2 to 6 hours under current directions). SEBI's CSCRF (2024) requires security operations (24x7 for market infrastructure institutions and other larger entity categories), log retention as set out in the framework and regular vulnerability scanning. CERT-In directions require reporting of specified cyber incidents within 6 hours and maintenance of logs for 180 days. The DPDP Act 2023 makes monitoring evidence critical for demonstrating reasonable security safeguards (Section 8(5)) and for detecting personal data breaches that must be intimated under Section 8(6).
Hypothetical example: Initial investigations by the finance team assumed vendor error. The security operations team, using a SIEM with UEBA rules, identified that refunds were initiated from an admin account outside business hours, from an unrecognized IP address and with altered browser user-agent strings. The account had been compromised through credential stuffing. Because monitoring detected the anomaly within 72 hours, the company reversed most refunds, revoked the account, notified affected customers and filed a CERT-In report. Post-incident, the platform implemented MFA for all admin accounts, geo-velocity alerts, and automated deactivation of accounts with impossible-travel signals.
Lessons:
- Centralize logs from all critical systems and retain them for at least 180 days.
- Build detection rules for India-specific fraud patterns (UPI, wallet refunds, coupon abuse).
- Test alerting paths quarterly and measure mean time to detect (MTTD).
- Document monitoring coverage as evidence for RBI/SEBI and ISO 27001 auditors.